Urbanization - Stormwater Runoff
Stormwater Runoff and Impervious Surfaces
 Perhaps the most defining characteristic of urban streams is the increased amount and rapidity of stormwater or surface runoff to those systems. Impervious surfaces associated with urbanization reduce infiltration and increase surface runoff (see Figure 16), altering the pathways by which water (and any associated contaminants) reach urban streams.
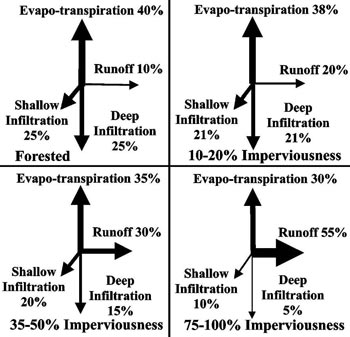 Figure 16. The shift in relative hydrologic flow in increasingly impervious watersheds. Note the large increase in stormwater runoff as imperviousness increases, at the expense of infiltration.
From Paul MJ & Meyer JL. 2001. The ecology of urban streams. Annual Review of Ecology & Systematics 32:333-365. © 2001 by Annual Reviews. Reprinted with permission.
- Roads
- Parking lots
- Rooftops
- Driveways and sidewalks
- Compacted soils
 Three common types of impervious surfaces in urban watersheds: roads, roofs and parking lots.
How Does Stormwater Runoff Affect Streams?
- It alters natural hydrology, generally leading to more frequent, larger magnitude and shorter duration peak flows.
- It alters channel morphology, generally leading to changes such as increased channel width, increased downcutting and reduced bank stability.
- It alters in-stream hydraulics, affecting biologically important parameters such as water velocity and shear stress.
- It disrupts the balance between sediment supply and transport, generally leading to increased sediment transport capacity and channel erosion.
- It increases stream temperatures, due to the transfer of heat from impervious surfaces to stormwater runoff.
- It increases delivery of pollutants from the landscape to the stream. Pollutants commonly found in stormwater runoff include:
- Sediment
- Nutrients
- Pesticides
- Wear metals
- Organic pollutants
- Oil and grease
Effective vs. Total Imperviousness
- Total impervious area (TIA) = all impervious area in catchment.
- Effective impervious area (EIA) = impervious area in catchment that is directly connected to stream channels (i.e., precipitation falling on that area is effectively transported to stream).
- Geographic information system data combined with stormwater infrastructure overlays.
- Published empirical relationships between TIA and EIA (Alley and Veenhuis 1983, Wenger et al. 2008).
- Field assessments.
Many studies have found that EIA (also known as drainage connection or directly connected impervious area) is a better predictor of ecosystem alteration in urban streams. For example, Hatt et al. (2004) showed that % connection was more strongly related to water chemistry variables (e.g., conductivity, total phosphorus) than % total imperviousness, during both baseflows and stormflows (Figure 17).
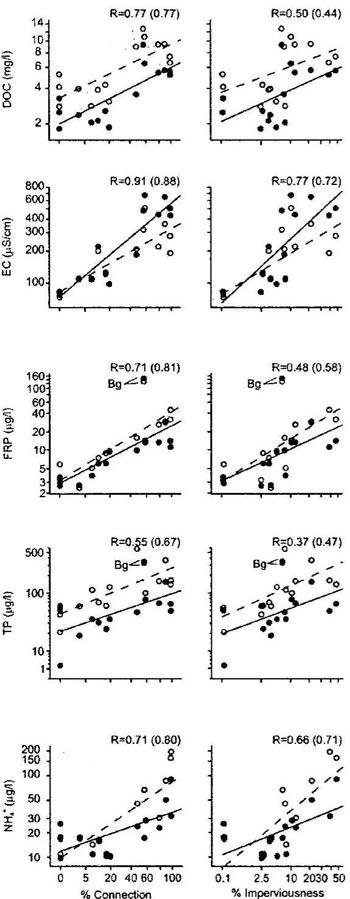 Figure 17. Relationships between geometric means of baseflow (close circles, solid regression lines) and storm event (open circles, dashed regression lines) concentrations and two impervious cover variables: % drainage connection and % total imperviousness. R values provided as baseflow concentrations (storm event concentrations). DOC = dissolved organic carbon; EC = electrical conductivity; FRP = filterable reactive phosphorus; TP = total phosphorus; NH4+ = ammonium.
 From Hatt BE et al. 2004. The influence of urban density and drainage infrastructure on the concentrations and loads of pollutants in small streams. Environmental Management 34(1):112-124. Reprinted with permission from Springer Scientific+Business Media.
The strength of EIA relationships suggests that stormwater management techniques aimed at disconnecting impervious areas from stream channels can improve urban water quality (Walsh et al. 2005b).
Imperviousness and Biotic Condition
Total or effective impervious cover has been linked to numerous changes in stream biotic assemblages. These changes include but are not limited to):
- Increased abundance or biomass.
[Walsh et al. 2006b, Busse et al. 2006] - Other changes in assemblage structure.
[Walsh et al. 2005b]
- Decreased total abundance, richness or diversity.
[Walsh 2004, Moore and Palmer 2005, Utz et al. 2009] - Decreased EPT abundance, richness or diversity.
[Walsh 2004, Walsh et al. 2005b, Schiff and Benoit 2007] - Other changes in assemblage structure (e.g., functional feeding groups).
[Stepenuck et al. 2002, Wang and Kanehl 2003] 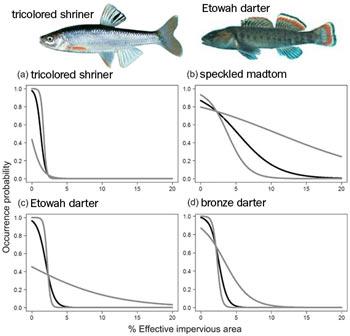 Figure 18. Occurrence probability of four fish species vs. impervious cover. Black line represents response curve based on mean parameter estimate for effective impervious area (EIA); gray lines represent response curves based on 5% and 95% values for parameter estimate for EIA. For three of the four species (all but speckled madtom), occurrence probability was predicted to approach zero at approximately 2-4% effective impervious cover.
From Wenger SJ et al. 2008. Stream fish occurrence in response to impervious cover, historic land use, and hydrogeomorphic factors. Canadian Journal of Fisheries and Aquatic Sciences 65:1250-1264. © 2008 NRC Canada or its licensors. Reproduced with permission.
Photos courtesy of Noel Burkhead, USGSDecreased quality of biotic index scores.
[Morley and Karr 2002, Walsh et al. 2005b, Schiff and Benoit 2007]
- Decreased abundance, biomass, richness or diversity.
[Wang et al. 2001, Wang et al. 2003, Stranko et al. 2008] - Other changes in assemblage structure (e.g., loss of individual species, changes in reproductive guilds).
[Wenger et al. 2008 (Figure 18), Helms et al. 2009] - Decreased quality of biotic index scores.
[Wang et al. 2001, Wang et al. 2003]
Thresholds of Imperviousness
Relationships between impervious cover and stream condition measures, defined by physical, chemical or biological parameters, can take several forms (see Figure 19). When the relationship is linear, any increase in imperviousness results in a decrease in condition (see Figure 19, yellow and Figure 20). In other cases, there may be threshold values of impervious cover above which condition either decreases rapidly (Figure 19, green) or remains consistently low (see Figure 19, blue and Figure 21).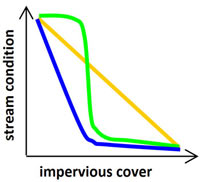 Figure 19. Example relationships between stream condition and impervious cover: a linear decline in condition (yellow); an upper threshold switching to a lower threshold (green); a linear decline to a lower threshold (blue).
 Modified from Walsh et al. (2005a).
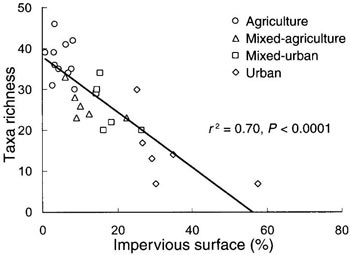 Figure 20. Relationship between total macroinvertebrate richness and % impervious surface cover in 29 headwater Maryland streams sampled in 2001. Taxa richness declined linearly with increasing impervious cover.
 From Moore AA & Palmer MA. 2005. Invertebrate biodiversity in agricultural and urban headwater streams: implications for conservation and management. Ecological Applications 15(4):1169-1177. Reprinted with permission.
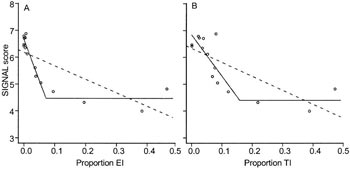 Figure 21. SIGNAL scores (a biotic index) for macroinvertebrates in edge habitats vs. (A) effective imperviousness (EI) and (B) total imperviousness (TI). Solid lines are piecewise regressions, dashed lines are linear regressions; the piecewise regression for EI provided the best fit. Note that the threshold value was 0.07 for EI, approximately half the threshold value for TI.
 From Walsh CJ et al. 2005. Stream restoration in urban catchments through redesigning stormwater systems: looking to the catchment to save the stream. Journal of the North American Benthological Society 24(3):690-705. Reprinted with permission.
- Consistent channel instability when EIA > 10%.
[Booth and Jackson 1997] - Different geomorphic response patterns (e.g., in terms of depth diversity, maximum pool depth) across sites with < 13% vs. > 24% TIA.
[Cianfrani et al. 2006] - Consistently higher conductivity, dissolved organic carbon and filterable reactive phosphorus when EIA > 5%, 4%, and 1%, respectively.
[Walsh et al. 2005b] - Uniformly low summer baseflow when TIA > 40%.
[Finkenbine et al. 2000]
- Consistently high algal biomass when EIA > 5%, low diatom index value when EIA > 2%.
[Walsh et al. 2005b] - Sharp declines in macroinvertebrate diversity and richness when TIA between 8-12%.
[Stepenuck et al. 2002] - Invertebrate taxa sensitive to impervious cover lost when TIA between 2.5-15% in Piedmont streams and between 4-23% in Coastal Plain streams.
[Utz et al. 2009] - Brook trout absent when TIA > 4%.
[Stranko et al. 2008] - Occurrence probability of three sensitive fish species approaches zero when EIA between 2-4%.
[Wenger et al. 2008] - Sharp declines in fish IBI score and trout abundance when EIA between 6-11%, consistently low values when EIA > 11%.
[Wang et al. 2003]