Urbanization - Water and Sediment Quality
Water and Sediment Quality in Urban Streams
- Increased dissolved solutes or conductivity (see Table 5)
- Increased suspended solids or turbidity
- Increased fecal bacteria
- Increased nitrogen and phosphorus (see Table 5)
- Decreased dissolved oxygen
- Increased toxics (see Table 5, Figure 22)
- Metals (e.g., Cd, Cr, Cu, Hg, Ni, Pb, Zn)
- Polycyclic aromatic hydrocarbons (PAHs)
- Polychlorinated biphenyls (PCBs)
- Pesticides (e.g., chlordane, chlorpyrifos, diazinon)
- Pharmaceuticals (e.g., antibiotics, hormones, anti-depressants, ibuprofen)
- Other organic pollutants (e.g., caffeine, triclosan, detergents, fragrances)
| Location [Reference] | Parameter | Least Urban Site | Most Urban Site |
|---|---|---|---|
| Malibu Creek, CA [Busse et al. 2006] |
% Impervious | 2 | 55 |
| Conductivity (μS cm-1) |
670 | 3060 | |
| SRP* (μg L-1) |
43 | 75 | |
| DIN* (μg L-1) |
30 | 521 | |
| Etowah River, GA [Roy et al. 2003] |
% Urban | 5 | 61 |
| Conductivity (μS cm-1) |
21 | 172 | |
| SRP (μg L-1) |
8 | 135 | |
| NH4-N (μg L-1) |
0.6 | 2.0 | |
| Charles River and Stillwater River, MA [Chalmers et al. 2007] |
% Urban | 2 | 97 |
| PAHs (mg kg-1) |
1.2 | 32.5 | |
| PCBs (mg kg-1) |
<0.1 | 0.3 | |
| Cr (μg g-1) |
36 | 92 | |
| Pb (μg g-1) |
73 | 250 | |
| * DIN = dissolved inorganic nitrogen; SRP = soluble reactive phosphorus | |||
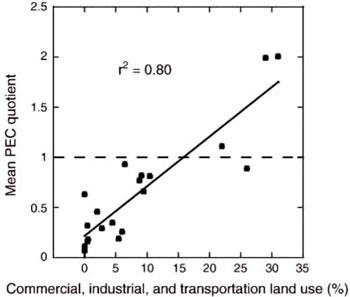 Figure 22. Overall sediment quality, as indicated by mean probable effect concentration (PEC) quotient, vs. commercial, industrial and transportation land use. PEC quotient = contaminant concentration/PEC for that contaminant; at each site, PEC quotients for metals, chlorinated hydrocarbons, and PAHs were averaged to determine mean PEC quotients.
 From Chalmers AT et al. 2007. The chemical response of particle-associated contaminants in aquatic sediments to urbanization in New England, U.S.A. Journal of Contaminant Hydrology 91:4-25. Reprinted with permission from Elsevier.
 Exposure of aquatic organisms to these pollutants can result in toxic effects specific to each pollutant’s mode of action. The following pages focus on a few urban-specific water and sediment quality issues in greater depth. More detailed information on many of these parameters can be found in CADDIS’ individual stressor modules.
Urbanization and Conductivity
Increases in conductivity or similar measures of ionic strength are among the most consistently documented water quality changes associated with urbanization. For example, Kaushal et al. (2005) examined salinization of suburban and urban streams in Maryland. They found that chloride concentrations exceeded thresholds for sensitive freshwater taxa at sites with greater than 40% impervious cover (Figure 23). In winter, chloride concentrations reached peaks of nearly 25% the concentration of seawater. Concentrations remained up to 100 times higher than at forested and agricultural non-impervious sites throughout the year.
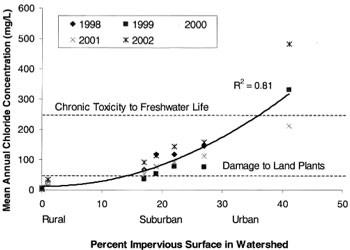 Figure 23. Relationship between impervious surface and mean annual chloride concentration in Baltimore Long Term Ecological Research (LTER) streams, 1998-2002. Dashed lines indicate thresholds for damage to certain land plants and for chronic toxicity to sensitive freshwater taxa (U.S. EPA 1988).
 Reprinted from Kaushal SS et al. 2005. Increased salinization of freshwater in the northeastern United States. Proceedings of the National Academy of Sciences 102 (38):13517-13520. © 2005 National Academy of Sciences, U.S.A. Reprinted with permission.
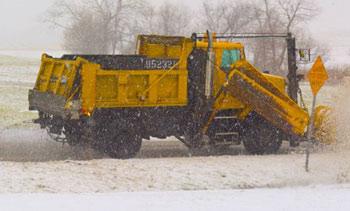 Road salt and other deicers can contribute to elevated stream conductivity in northern urban catchments.
This increase in dissolved solutes in urban streams has been attributed to several sources, including:
- Road salt and other deicing agents (in northern regions)
- Point source discharges (e.g., WWTP and industrial effluents)
- Leaky sewer and septic systems
- Concrete weathering
Some studies have shown that urbanization-associated changes in conductivity are related to shifts in biotic assemblages. For example:
- Roy et al. (2003) found that specific conductance was a significant predictor of invertebrate responses to urbanization. It was negatively related to total invertebrate richness, EPT richness, total invertebrate density and several benthic invertebrate indices.
- Helms et al. (2009) found that streams with high concentrations of total dissolved solids were dominated by sunfish-based fish assemblages.
However, in many cases it is believed that conductivity is a general indicator of overall urban impact, rather than a direct cause of observed biotic effects.
Nitrogen in Urban Streams
One common water quality change associated with urban development is an increase in nutrient concentrations, especially nitrogen (Figure 24, Table 6). Wastewater inputs and stormwater runoff both contribute to increased nitrogen loading in urban catchments.
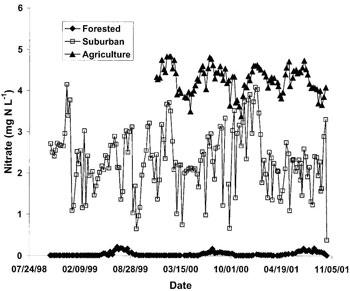 Figure 24. Nitrate concentrations in three streams draining completely forested, suburban, and agricultural watersheds in Baltimore County, MD, October 1998–October 2001.
 From Groffman PM et al. 2004. Nitrogen fluxes and retention in urban watershed ecosystems. Ecosystems 7:393-403. Reprinted with permission from Springer Science+Business Media.
| Parameter | Urban | Forest | |
|---|---|---|---|
| Total N loading (kg km-2 y-1) |
Wet deposition (DIN) | 494 | 496 |
| Dry deposition (DIN) | 290 | 290 | |
| Net waste N | 350 | 586 | |
| Fertilizer N | 1443 | 395 | |
| SUM | 2578 | 1767 | |
| River N exports (kg km-2 y-1) |
DIN (NO3 + NH4) | 333 | 7.5 |
| DON | 51.5 | 51.6 | |
| SUM | 384.5 | 59.1 | |
| N retention (%) | 85 | 97 | |
| Modified from Wollheim WM et al. 2005. N retention in urbanizing headwater catchments. Ecosystems 8:871-884. | |||
- Human wastes
- Wastewater treatment plant effluents
- Leaky sewer and septic systems
- Atmospheric deposition
- Vehicle exhaust
- Other forms of fossil fuel combustion
- Fertilizers applied to lawns and golf courses
- Pet wastes
- Landfill leachates
- Legacy sources (e.g., development of agricultural land)
In addition, riparian alteration can affect nitrogen uptake and cycling, and turn urban riparian areas into nitrogen sources (Groffman et al. 2002, 2003).

Although nitrogen loading to and export from urban streams typically are elevated, many studies also have found relatively high nitrogen retention [Groffman et al. 2004, Wollheim et al. 2005 (Table 6)] in these systems. Pervious surfaces such as lawns may act as nitrogen sinks in urban areas (Raciti et al. 2008) and help to mitigate at least some nitrogen loading increases. However, this mitigation may be limited as fertilizers often are over-applied in urban systems.
PAHs
Polycyclic aromatic hydrocarbons (PAHs) are common pollutants in urban streams, resulting from numerous transportation-related sources including oil leakage, vehicle exhaust, tire and brake wear, and pavement erosion. Many studies have shown that these compounds can adversely affect stream biota (e.g., Maltby et al. 1995, Pinkney et al. 2004).

 Figure 25. Regression plot of the decrease in (A) macroinvertebrate richness and (B) density between sites upstream and downstream of seal-coated parking lots, as a function of the increase in PAH equilibrium partitioning sediment benchmark toxicity units (ESBTUs) in pool sediments between those sites. ESBTUs were based on 16 EPA priority PAH pollutants; values > 1 suggest toxicity.
From Scoggins M et al. 2007. Occurrence of polycyclic aromatic hydrocarbons below coal-tar-sealed parking lots and effects on stream benthic macroinvertebrate communities. Journal of the North American Benthological Society 26(4):694-707. Reprinted with permission.- PAH concentrations were 65 times higher in runoff from coal-tar seal-coated parking lots versus unsealed parking lots (Mahler et al. 2005).
- PAH concentrations in stream sediments were 3.9 to 32 mg kg-1 higher downstream of coal-tar seal-coated parking lots versus upstream reference sites (Scoggins et al. 2007).
- Average macroinvertebrate densities were two times higher at sites upstream of seal-coated parking lots.
- Chironomid density decreased at sites downstream of seal-coated parking lots, whereas oligochaete density usually increased.
- Increases in pool habitat PAH sediment toxicity units between sites upstream and downstream of seal-coated parking lots explained decreases in macroinvertebrate richness and density (Figure 25).