Urbanization - Temperature
Urbanization and Stream Temperature
Urbanization often results in increased stream temperatures (e.g., increased daily maximum temperature, increased number of temperature exceedances), especially in summer. This is due in part to the formation of urban heat islands, or localized areas of heat storage (and warmer air temperatures) near urban centers. Many other aspects of urbanization also can contribute to stream warming:
- Riparian alteration can reduce canopy cover and shading, increasing solar radiation reaching the water surface.
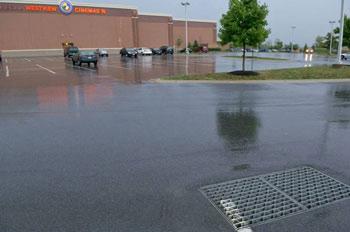
- Stormwater runoff from warm impervious surfaces can contribute heated surface runoff to surface waters, and reduce cooler groundwater inputs via decreased infiltration.
- Lower baseflows can lead to shallower water and standing pools, which warm quickly.
- Physical habitat changes such as channel widening can increase channel width:depth ratios, further reducing riparian shading and increasing surface area for heat exchange.
- Certain best management practices (BMPs) for urban streams, such as stormwater retention ponds, can increase water retention time and warming, particularly in unshaded systems.
- Wastewater inputs can lead to the direct discharge of warmer effluents into stream and rivers (Figures 26 and 27).
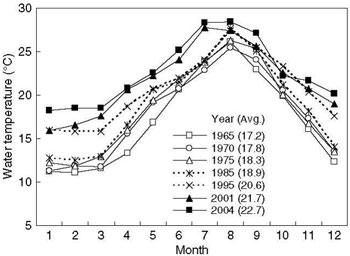 Figure 26. Monthly mean (plot) and yearly mean (legend) temperatures of wastewater effluents from all treatment plants located in the central Tokyo area, 1965-2004. Increases in effluent temperatures stem largely from increased residential use of heated water.
 From Kinouchi T. 2007. Impact of long-term water and energy consumption in Tokyo on wastewater effluent: implications for the thermal degradation of urban streams. Hydrological Processes 21:1207-1216. Reprinted with permission.
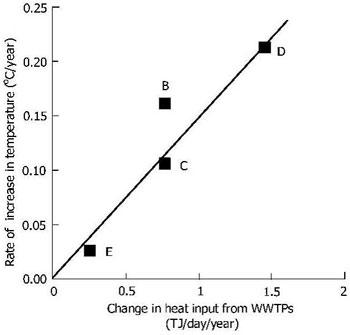 Figure 27. Change in wastewater heat effluent from wastewater treatment plants vs. the rate of temperature increase in four stream segments (B-E) in the Ara River system, central Tokyo. Kinouchi et al. (2007) contend that increased wastewater effluent temperatures contribute to the thermal degradation of effluent-receiving streams.
 From Kinouchi T et al. 2007. Increase in stream temperature related to anthropogenic heat input from urban wastewater. Journal of Hydrology 335:78-88. Reprinted with permission from Elsevier.
- Water/sediment quality – via decreased dissolved oxygen saturation, increased ammonia toxicity, and increased biotic uptake of toxic substances
- Energy sources – via increased microbial respiration and primary production
Elevated water temperatures can be stressful to aquatic organisms, and may result in numerous lethal and sublethal effects (e.g., death, increased disease susceptibility and decreased growth and reproduction). For further discussion of temperature as a cause of stream impairment, see the Temperature module.
Heated Surface Runoff From Impervious Surfaces
Impervious surfaces absorb and store heat, which is then transmitted to surface runoff during rainfall events. Several studies have shown positive correlations between impervious surface area and stream temperature (Wang et al. 2003, Nelson and Palmer 2007, Imberger et al. 2008, Stranko et al. 2008).
 Thompson et al. (2008) compared runoff temperatures from asphalt and sod surfaces during 24 rainfall simulations (see Figure 28 for one of these simulations).
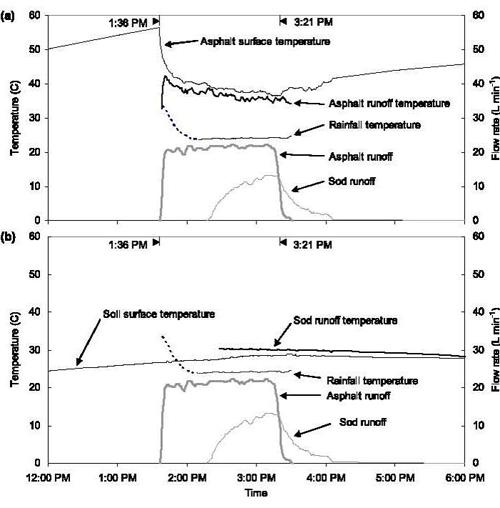 Figure 28. Temperature of (a) asphalt and (b) sod surface and runoff during July 15, 2005 rainfall simulation; asphalt and sod runoff and rainfall temperature are shown in both (a) and (b).
 From Thompson AM et al. 2008a. Thermal characteristics of stormwater runoff from asphalt and sod surfaces. Journal of the American Water Resources Association 44(5):1325-1336. Reprinted with permission.They found that:
- Asphalt surfaces were more than 20°C warmer than sod surfaces prior to rainfall simulations.
- Initial asphalt runoff temperatures were roughly 10°C warmer than sod runoff temperatures (35.0 vs. 25.5°C).
- Asphalt runoff temperature decreased by an average of 4.1°C over the 1-hour rainfall simulation.
- Air temperature and humidity
- Type of impervious surface (e.g., reflectance)
- Solar radiation before and during rainfall
- Rainfall intensity
- Rainfall temperature
Temperature and Biotic Condition in Urban Streams
Biotic responses associated with increased temperatures in urban streams include (but are not limited to):
Benthic Macroinvertebrates
- Decreased total abundance, richness or diversity
[Sponseller et al. 2001] - Decreased EPT abundance, richness or diversity
[Sponseller et al. 2001, Wang and Kanehl 2003] - Decreased quality of biotic indices
[Wang and Kanehl 2003, Walters et al. 2009]
Fishes
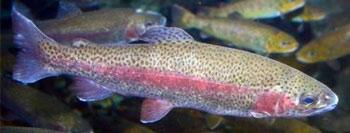 Rainbow trout (Oncorhynchus mykiss)
Photo courtesy of Wayne Davis, U.S. EPA
- Decreased quality of biotic indices
[Wang et al. 2003] - Decreased abundance, biomass, richness or diversity
[Wang et al. 2003 (Figure 29), Stranko et al. 2008]
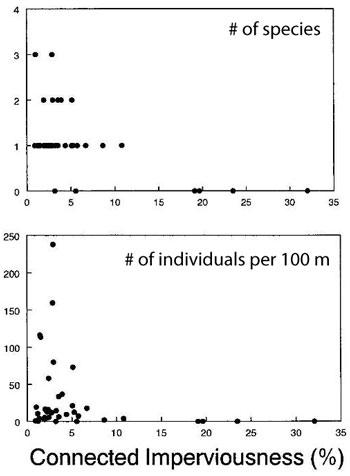 Figure 29. Relationship between % connected imperviousness and coldwater fish species richness and abundance in 33 Wisconsin and Minnesota trout streams.
 From Wang L et al. 2003. Impacts of urban land cover on trout streams in Wisconsin and Minnesota. Transactions of the American Fisheries Society 132:825-839. Reprinted with permission.
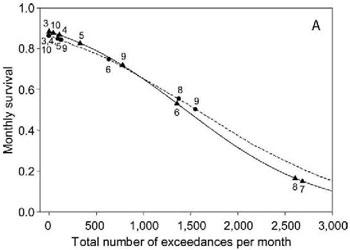 Figure 30. Estimates of monthly rainbow trout survival vs. number of temperature exceedances at upstream (circles, dashed line) and downstream (triangles, solid line) study reaches. An exceedance was defined as any 15-minute interval in which temperature exceeded 20°C; numbers represent months in which exceedances were recorded (e.g., 6=June).
From Runge JP et al. 2008. Survival and dispersal of hatchery-raised rainbow trout in a river basin undergoing urbanization. North American Journal of Fisheries Management 28:745-757. Reprinted with permission.
Coldwater fishes such as salmonids are among the taxa most affected by temperature increases. For example, Runge et al. (2008) found that the survival of stocked rainbow trout in the Chattahoochee River, Georgia, was negatively related to the amount of time water temperatures exceeded 20°C (Figure 30), and that fish dispersed from warmer downstream reaches to cooler upstream reaches.
It should be noted, however, that other studies have found little or no relationship between water temperature and biota in urban streams (Kemp and Spotila 1997, Walters et al. 2009). As with all urbanization-associated stressors, it often is difficult to determine which of these often correlated stressors are driving biotic responses.
Urbanization and Climate Change
An increasing number of studies are considering the potentially interactive effects of urbanization and climate change on stream ecosystems (Palmer et al. 2009). Some studies have focused on interactions between urbanization and climate change-associated changes in precipitation and runoff (Kaushal et al. 2008, Franczyk and Chang 2009, Han et al. 2009). Others have examined interacting effects on stream temperature
Nelson and Palmer (2007) and Nelson et al. (2009) developed models to predict the separate and combined effects of urbanization and climate change on small mid-Atlantic streams.
- Water temperatures exceeded the “good growth” temperature maximum for coolwater fish species (32°C) only rarely, and only in the urbanization plus climate change scenario.
- Water temperatures were highest under the scenario of increased urbanization plus a warming climate, especially in midsummer when there was heated runoff from impervious surfaces (Figure 31).
- Water temperatures exceeded the “good growth” temperature maximum for coldwater fish species (28°C) on an average of 49 days per 10-year period under the urbanization plus climate change scenario, vs. 24 days per 10-year period in the urbanization alone scenario (Figure 32).
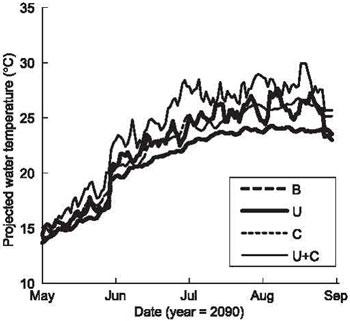 Figure 31. Projected maximum daily water temperatures for the year 2090 under four scenarios: baseline (B), urbanization (U), climate change (C), and urbanization plus climate change (U+C).
 From Nelson KC et al. 2009. Forecasting the combined effects of urbanization and climate change on stream ecosystems: from impacts to management options. Journal of Applied Ecology 46:154-163. Reprinted with permission.
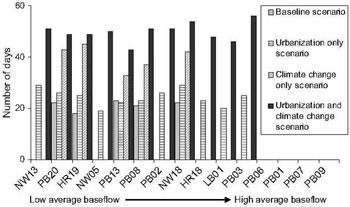 Figure 32. Predicted number of summer days with water temperatures > 28°C (summed over a 10-year period), at 15 sites ranging from low to high average baseflow, for four scenarios: baseline, urbanization, climate change, and urbanization plus climate change.
From Nelson KC & Palmer MA. Stream temperature surges under urbanization and climate change: data, models, and responses. Journal of the American Water Resources Association 43(2):440-452. Reprinted with permission.