Flow Alteration
On this Page
 Figure 1. The Chesapeake and Ohio Canal National Historical Park, Washington D.C., an example of a channelized overland flow diversion. Movement of water through stream and river channels influences all processes and biota within. The terms “flow,” “discharge” and “streamflow” often are used interchangeably to represent water volume passing a fixed channel location per unit time.
We broadly define “flow” to include current velocity, volume as a function of time, large event frequency, and other parameters that characterize a flow regime. We use the term “discharge” specifically in reference to volume as a function of time. Discharge is reported commonly as cubic meters per second (m3/s), cubic feet per second (cfs), gallons per minute (gpm), or acre-feet per year (ac-ft/yr).
Velocity can be thought of as a two-dimensional variable (length over time), whereas discharge is a four-dimensional variable (volume over time). This distinction's significance becomes evident when considering multiple sites along a stream reach. In the riffle, velocity is high, and in the pool immediately upstream, velocity is low. For both channel cross sections, however, discharge remains the same (assuming no inputs or diversions between the riffle and pool).
Flow characteristics vary longitudinally along a stream's channel and laterally from channel to floodplain, as a function of landscape features. Regional and temporal flow variability results from variance in rainfall patterns, vegetation, development, geology and other watershed characteristics. Biological characteristics at a given site relate to flow volume, velocity and variance (including rates of change, frequency, duration and timing). It may be appropriate to consider these different flow parameters as separate candidate causes.
Flow alteration refers to modification of flow characteristics, relative to reference or natural conditions. Human activities can significantly alter flow and may lead to biological impairment. For example, human activities may change how much water reaches a stream, divert flow through manmade channels (Figure 1) or alter stream shape and location. Changes to streamflow characteristics may benefit some aquatic organisms while harming others, thereby changing biotic community composition.
Stress related to flow alteration is closely tied to temporal variability and regional flow characteristics. For example, arid and seasonal streams of the western U.S. behave differently than temperate streams of the mid-Atlantic. Significant stressors in one region may be trivial for the biological community of the other.
Temporal and spatial variability make it difficult to characterize a watershed's flow regime. Rules of thumb (e.g., minimum required discharge) may be insufficient when linking flow regime to ecological function (Arthington et al. 2006). Aggregate characteristics (e.g., discharge measured at a gauge) depend on watershed-wide landscape features and precipitation patterns. However, localized flow information (e.g., water velocity and depth) may reflect the condition of a particular reach as well as watershed properties.
Along with challenges described above, flow alteration often interacts with other stressors to cause impairment. Flow is connected to multiple biotic and abiotic components of aquatic ecosystems (Power et al. 1995). Causal assessors should consider potential interactions when listing candidate causes (see below).
Checklist of Sources, Site Evidence and Biological Effects
This module provides advice for deciding whether to include flow alteration in your list of candidate causes, as well information on measuring flow alteration. Flow alteration should be listed as a candidate cause when potential human sources and activities, site evidence, and biological effects support portions of source-to-impairment pathways (see Figure 2).
The checklist below will help you identify key data and information useful for determining whether to include flow alteration among your candidate causes. The list is intended to guide you in collecting evidence to support, weaken or eliminate flow alteration as a candidate cause. For more information on specific entries, go to the When to List tab.
 Figure 2. A simple conceptual diagram, depicting pathways from sources to biological responses, for flow alteration. Click on diagram to enlarge.Consider listing flow alteration as a candidate cause when the following sources and activities, site evidence and biological effects are present:
Sources and Activities
- Point source inputs
- Water withdrawals
- Land cover alteration (e.g., impervious surfaces)
- Storm drain systems
- Agricultural tile drainage
- Channel alteration
- Impoundment
Site Evidence
- Channel erosion
- Scouring and incision
- Dry stream
- Channel features incongruous with observed flow
- Discharge data inconsistencies
Biological Effects
- Reduced productivity
- Changes in community composition
- Increased generalists and decreased specialists
- Replacement of native species by invasive or exotic species
- Disrupted reproductive cycles
- Decreased taxonomic richness and diversity
Consider contributing, modifying and related factors as candidate causes when flow alteration is selected as a candidate cause:
- Dissolved oxygen: Oxygen enters streams in various ways including atmospheric diffusion and entrainment from riffles and waves. Changes to flow may reduce surface area and turbulence, which can decrease dissolved oxygen and stress organisms. In this case, dissolved oxygen would be considered the proximate stressor, while flow alteration is a step in the causal pathway.
 Figure 3. Impact of low dissolved oxygen and low current velocity on selected organisms. Organism lines represent various mayfly nymphs and the point at which survival is compromised by lack of oxygen and reduced flow velocity.
Image adapted from Jaag and Ambühl (1964).
The two stressors also may act jointly. For example, when oxygen concentrations in the water column are low, less oxygen flows past the respiratory structures of aquatic organisms. In this case, both current velocity and dissolved oxygen concentration may determine the fate of organisms without actively ventilated gills (see Figure 3).
- Ionic strength: Increased discharge can dilute toxic substances (e.g., ions and metals) and decrease toxicity; decreased discharge can have the opposite effect. However, increased discharge often results from increased surface runoff, which can deliver increased loads of nutrients, sediment, ions, metals and other toxics to streams. In addition, decreased flow velocity may allow increased deposition of particle-associated toxic substances.
- pH: See ionic strength (above).
- Metals: See ionic strength (above).
- Nutrients: See ionic strength (above).
- Sediments: See ionic strength (above) and physical habitat (below).
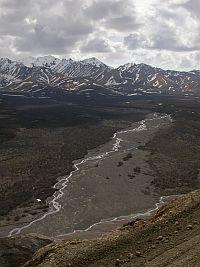 Figure 4. A braided, meandering channel and floodplain in Denali National Park, Alaska. Physical habitat: Flow is closely tied to fluvial geomorphological processes and related habitat features. Physical channel processes (e.g., deposition, erosion) partly define a channel’s dynamic and natural condition.
Flow transports material (e.g., sediment, woody debris) through stream systems and reshapes channels and floodplains (see Figure 4). Habitat features such as boulders and woody debris may affect flow at local and reach scales by altering velocity and water depth. Habitat and flow alteration can serve as proximate stressors, while significantly influencing each other through physical processes as steps in a causal chain.- Temperature: Flow alteration may interact with water temperature in a variety of ways. For example, altered overland flow may decrease groundwater recharge and, consequently, lead to reduced cold groundwater inputs to streams, potentially increasing stream temperatures. For this particular example, flow alteration might be referred to as a step in the causal pathway leading to increased water temperature—the proximate stressor.
- Unspecified toxic chemicals: See ionic strength (above).
 Figure 5. A combined sewer overflow (CSO) discharge point (i.e., a point source discharge) on the Potomac River in Washington D.C.
On this Page
- Sources and Activities that Suggest Listing Flow Alteration as a Candidate Cause
- Site Evidence that Suggests Listing Flow Alteration as a Candidate Cause
- Biological Effects that Suggest Listing Flow Alteration as a Candidate Cause
- Site Evidence that Supports Excluding Flow Alteration as a Candidate Cause
Sources and Activities that Suggest Listing Flow Alteration as a Candidate Cause
The natural flow regime of a stream or river may be altered by various human activities, within the channel or the watershed. The more extensive the relevant sources and activities, the more likely increased flow alteration will impair surface waters.
Point source inputs: Anthropogenic inputs to streams include untreated sewage and stormwater (see Figure 5), wastewater treatment plants, and industrial operations. These inputs can increase flow or provide a source of flow in an otherwise dry channel. Redirecting flow from one watershed to another, or transbasin diversions, also may increase flow in one stream (point source), while decreasing flow in another (water withdrawal; see below).
Water withdrawal: Surface water and groundwater withdrawals can alter flow by reducing water volumes in streams. Withdrawals may return to the surface/groundwater system at a point further downstream, be removed from the watershed through transpiration by crops, lawns or pastures, or be transferred to another watershed altogether (e.g., water transferred to a different watershed for drinking supply).
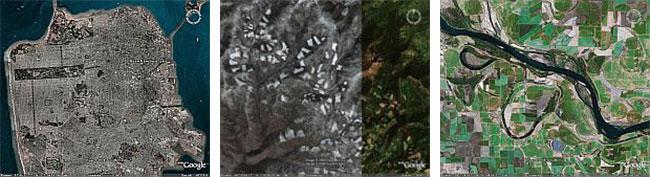 Figure 6. Aerial images (each approximately 15 km wide) showing landscape features associated with urban, forestry, and agricultural land uses that can affect infiltration and alter overland flow. From left to right, the first image shows the city of San Francisco, CA, and its associated impervious surfaces which reduce infiltration. The second image shows Okanogan National Forest in north-central Washington, with road networks and patches where trees have been removed by logging activity (highlighted by snow cover in the left two-thirds of the image), generally decreasing the retention of storm water in those areas. The image on the right shows the Arkansas River, immediately upstream of its confluence with the Mississippi River; the patchwork of agricultural fields near the river, in various shades of brown and green, can alter flow regimes through altered infiltration rates and irrigation.
Photos curtesy of Google Earth (accessed 12/21/2006)
Land cover alteration: Changes in land cover (Figure 6) alter hydrologic processes including infiltration, uptake of runoff by vegetation, and the efficiency of overland flow. 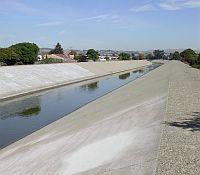 Figure 7. An engineered open and trapezoidal concrete channel; this structure increases the efficiency with which overland flow travels across the landscape. Surfaces with low permeability decrease watershed-wide infiltration and increase the efficiency or speed at which surface runoff reaches streams.
Impervious surfaces generally offer less resistance to overland flow than do areas covered by natural vegetation. Thus, flow is flashier with higher peak flows, shorter duration flow events, and more frequent high flows. Additionally, decreased watershed infiltration often decreases groundwater recharge, consequently decreasing stream baseflow. Impervious surfaces, and other reduced permeability surfaces, include roads, parking lots, roofs, and compacted surfaces such as pastures and logging access roads.
Storm drain systems: 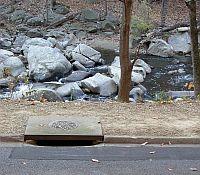 Figure 8. A connection between Rock Creek and a road drainage system in Rock Creek National Park, Washington, D.C. Stormwater systems (see Figure 7) and roadside ditches and culverts (see Figure 8) frequently accompany land cover alterations and urbanization. Storm drain systems generally reduce groundwater recharge and increase the efficiency with which precipitation reaches streams by reducing overland flow resistance, in contrast to natural surfaces (e.g., forested areas and natural channels), and by providing direct travel routes for runoff to streams via conduits with smooth surfaces (e.g., concrete and metal).
The resulting reduction in groundwater recharge and related subsurface flows may decrease stream baseflows and increase the likelihood of flow intermittency or cessation.
Agricultural tile drainage: Agricultural drainage systems are often used to intentionally reduce soil moisture for optimal growing conditions by moving precipitation or irrigation waters from subsurface soils, through pipes and eventually into ditches or streams thereby increasing flow. Like storm drain systems, tile drains reduce groundwater recharge.
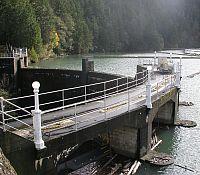 Figure 9. Glines Canyon Dam, located on the Elwha River in Olympic National Park, Washington, has changed the downstream flow regime and converted the upstream ecosystem into a reservoir (Lake Mills). When the photograph was taken in 2005, the U.S. National Park Service was planning to remove the dam. Channel alteration: Structural habitat changes include straightening or restructuring natural watercourses. This can involve adding rip-rap to stabilize a stream bank, installing a dam or road crossing, or removing large woody debris. Reduced sinuosity may shorten the distance water travels and increase water velocity. Engineered channels designed to prevent overbank flooding can eliminate or reduce floodplain connectivity. Some organisms (e.g., certain spawning fish) rely on floodplain habitats, which may only be accessible when storm flows rise above channel banks. Channelization also alters channel bathymetry and gradient, thereby reducing structural habitat heterogeneity and riffle/pool variability.
Impoundment: Detention basins, retention basins, and dams (Figures 9 and 10) can affect flow regime in various ways, via actively controlled or passive-release mechanisms. For example, detention basins tend to reduce peak flows during precipitation events or prevent water from reaching a stream during periods of low flow. Similarly, storage dams may reduce or prevent seasonal variation of downstream flow, and decrease the frequency of floodplain inundation. However, hydroelectric dams may increase variance in flow if they are used for peaking power.
Site Evidence that Suggests Listing Flow Alteration as a Candidate Cause
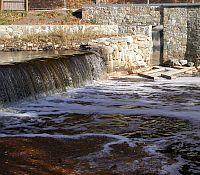 Figure 10. A small dam and its associated fish ladder in Rock Creek National Park, Washington, D.C. In addition to observations of sources discussed above, the following site observations may suggest listing flow alteration as a candidate cause. However, note that single, point-in-time observations also may be indicative of natural channel processes. Flow characteristics, structural habitat conditions and associated biological attributes at a given point in a stream depend on various in-stream and watershed-wide factors upstream, which can change with time. Therefore, the following site observations should be considered in the context of the associated ecosystem and other local factors, such as precipitation and geology.
Channel erosion: Bank erosion and instability, undercut banks and exposed roots, particularly in channel areas not confined to outside bends, may suggest that peak flows have increased in magnitude (discharge and velocity) and/or frequency (Figure 11).
Scouring and incision: Channel scouring, incision, or downcutting suggest altered flow conditions characterized by increased peak flow magnitude (discharge and velocity) and/or frequency of high flow events. Scouring flows may act to dislodge organisms (i.e., flow as a proximate cause of impairment) and to alter substrate composition or structural habitat (i.e., flow as a step in a causal chain).
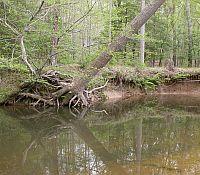 Figure 11. Signs of active channel erosion include exposed roots and undercutting. Dry stream: A dry stream bed may suggest including flow alteration as a candidate cause. Land cover changes, for example, can eliminate between-storm baseflow. Note, however, that some streams, particularly in the western U.S., are naturally intermittent due to seasonal and regional precipitation patterns. Whether the dry channel is natural or un-natural, flow alteration may be included because aquatic organisms often are sensitive to the timing and duration of zero flow conditions.
Channel features incongruous with observed flow: Observation of a “normal” precipitation event—for example, an event of magnitude that might happen about once per year or once every other year—for which flow levels do not reach bank-full channel features and/or floodplain terraces, may suggest that larger events (altered flow conditions) are dictating channel geometry and evolution.
Discharge data inconsistencies: A plot showing both precipitation and stream discharge (see Ways to Measure tab) may alert causal assessors of certain flow alterations. Zero baseflow between precipitation events may indicate that land cover alterations (e.g., impervious surfaces) have created a flashy hydrologic system, marked by higher peak flows, but reduced baseflow. Conversely, if discharge is relatively constant regardless of precipitation, wastewater dominance or control of flow by a dam might be altering flow characteristics.
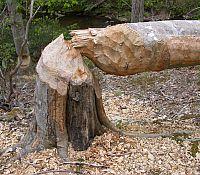 Figure 12. A recently downed tree showing telltale beaver teeth marks. Beaver activity: Signs of beaver activity, such as freshly downed trees (see Figure 12) may suggest that flow regime is being altered or has already been changed. Unlike sources and observations discussed in the context of causal assessment and CADDIS, beaver dams and related activities are natural phenomena and have many ecological benefits. If flow alteration is under consideration, causal assessors may benefit from acknowledging and distinguishing between natural and anthropogenic processes.
Anecdotal information may strengthen site observation evidence. A classic example is that of the scientist walking up to a dry stream and a local resident curiously joining the scientist streamside; the resident says, "I remember 50 years ago when this creek had water flowing through it everyday of the year, and now it's bone dry unless it rains." Such information would be sufficient to include flow as a candidate cause, but the credibility of anecdotal information must be checked during the causal analysis.
Biological Effects that Suggest Listing Flow Alteration as a Candidate Cause
Fish, invertebrates and aquatic plants vary in their preferences for specific flow characteristics. Here we present examples of biological effects of flow alteration, reported in several synthesis documents linking the disciplines of hydrology and ecology (The Nature Conservancy 2006, Biggs et al. 2005, Bragg et al. 2005, Bunn and Arthington 2002, Poff et al. 1997, Poff and Ward 1989). The general trend among scientists is to connect flow alteration parameters with biological effects. Effects typically are described in the context of species traits, functional adaptations, life history characteristics, or community structure (Roy et al. 2005, Lytle and Poff 2004, Goldstein and Meador 2004). The following examples are categorized in terms of common flow alteration parameters.
Changes in magnitude and duration of low flows: Cessation of flow, extreme low flows, or prolonged duration of low flow conditions can reduce overall habitat availability by decreasing water volume and wetted channel area. This alteration has been linked to reduced total stream productivity, elimination of large fish, changes in taxonomic composition of fish communities, fewer species of migratory fish, fewer fish per unit area, and a greater concentration of some aquatic organisms (potentially benefiting predators). Prolonged duration of low flows tends to favor invertebrate and fish species that prefer standing-water habitats or species classified as generalists. Conversely, extreme low flows that are not unusual for the channel of interest may benefit aquatic systems, by purging invasive or non-native species maladapted to such conditions.
Changes in frequency and magnitude of peak flows: High-flow events can physically remove species from the channel to a downstream location. The literature generally refers to this process as dislodgment, wash-out, scouring, or flushing of organisms. Mobilization of pebbles, sediment, woody debris, and plant material, in addition to movement of water itself, also can dislodge organisms. More frequent high-flow events can decrease species richness by eliminating or reducing populations that do not fare well under high-flow conditions. Invertebrate assemblages consisting of species with long life cycles may shift compositionally to include more species with relatively short life cycles. Conversely, fewer high-flow events and peak flow events that are lower in magnitude may disconnect the channel from its floodplain, reducing access to fish spawning habitat and juvenile fish nursery areas.
Altered seasonality of flows: Many aquatic organisms rely on consistent seasonal flow patterns (e.g., flow increases with spring snow melt) to cue life history events. Altered or reduced seasonality of flows, including changes in the timing of rising flows and flow peaks, may disrupt natural cues for invertebrate life cycles and for migration, spawning, and egg hatching of fish. For example, Peckarsky et al. (2000) discuss the life cycle traits and cues common to the mayfly genus Baetis in connection to flow regime. Specifically, baetid mayflies oviposit on rocks based partly on the timing of rock appearance above the water line, and therefore, seasonal changes in water depth play a role in cueing reproductive processes of baetid mayflies.
Changes in flow variability: The natural variability of a stream's flow regime usually includes peak flow diversity combined with occasional periods of drought. Dams with regulated releases can stabilize water flow, thus reducing variability. This flow stabilization may provide an opportunity for invasive or exotic species to establish and displace native species. Additionally, native specialist organisms, adapted to a particular combination of high and low flows, may be replaced by generalist species, which may not otherwise compete successfully with native species under more natural flow conditions. Decreased variability in flow can reduce fish populations and diversity of the invertebrate community.
Site Evidence that Supports Excluding Flow Alteration as a Candidate Cause
There are no site observations that specifically provide evidence of the absence of flow alteration. We caution against using benchmarks of effects (e.g., water quality criteria) as evidence for excluding flow alteration from your initial list of candidate causes, because different species have different flow requirements and different sites have different naturally occurring levels of flow.
In the context of causal assessment, water depth, volume, velocity, and discharge (each of which varies with time and space) are considered part of the flow regime. Discharge is often a primary focus of hydrologic studies (especially large scale studies), but the existence, quality, and accessibility of hydrologic data may dictate which measures of flow alteration are used in any given causal assessment.
A good place to start your search for hydrologic data might be the U.S. Geological Survey's (USGS's) StreamStats.
This on-line tool provides watershed characteristics and flow statistics for both gauged and ungauged streams. Gauged site data come from data collection stations, while ungauged site information is estimated (assuming natural unaltered or natural flow) using Geographical Information System (GIS) technology.
Discharge
 Figure 13. A single-event flow hydrograph.Continuous discharge rarely is measured directly. Instead, flow gauges typically measure instantaneous water depth (i.e., stage) at intervals (e.g., every 5 to 60 minutes). A rating curve (plot of discharge versus stage height) then can be used to convert stage to discharge. To construct a rating curve, measurements of discharge are made for a channel cross-section under a range of flow conditions (e.g., baseflow, small storms and large storms). Discharge can be estimated by measuring flow velocity and water depth at several points across the width of a channel [for more information on field hydraulic measures, see Rantz (1982)]. The USGS is the primary U.S. agency that collects flow data. In addition, local government agencies, state biologists, consulting firms, or other entities may provide causal assessors with discharge data over time or rating curves and measured depth of flow; causal assessors should consider differences between raw and calculated data in terms of accuracy, collection techniques and underlying calculation assumptions.
 Figure 14. Hydrographs showing generalized flow conditions for a stream before and after urbanization.Hydrographs, plotted as discharge versus time (see Figure 13), can be used to characterize flow at a given stream cross-section. The shape of a hydrograph following a precipitation event reveals information about the contributing watershed's flow regime, and is characterized by several parameters. These parameters include:
- Volume of flow, or the area under the hydrograph
- Magnitude or peak flow
- Duration of the event above a certain flow
- Rate of change from, say, low to peak discharge and back again (i.e., a flashy system)
- Lag time, or time between the rainfall center of mass and flow volume center of mass
For causal assessment, hydrographs of reference versus impaired streams or hydrographs before and after a disturbance might be compared to determine, for example, the impacts of urbanization (see Figure 14), dams or channelization.
Figures 13 and 14 show discharges resulting from single rain events. Sometimes, it is advantageous to analyze a hydrograph for one or more water years (typically, October 1st of year X, to September 30th of year X+1) to better understand frequency of small events, seasonal variation of flow, and baseflow levels or groundwater inputs between precipitation events.
Statistical Measures
Long-term flow data may be used to develop statistical descriptors of flow regime. A common statistical measure of flow is event frequency (sometimes expressed as recurrence interval or return period). A 10-year flow event is an event with a magnitude predicted to recur once every ten years; such an event has a 10% chance of happening in any given year. USGS provides guidance for estimating flow frequency (U.S. Interagency Advisory Committee on Water Data 1982). Flood management often focuses on large events with low frequency (e.g., 10- to 100-year events), although smaller events with greater frequency play an equally important role in geomorphological and ecological processes. Cunnane (1978) provides an equation for estimating sub-annual return periods—that is, recurrence of small events within a year.
Duration was mentioned above in the context of a single event (i.e., length of time flow is above a certain magnitude). Flow duration also can be calculated for longer time periods. For example, flow duration can be defined as the length of time (generally, the number of days) per year in which a stream's discharge is greater than a particular value.
Software has been developed to calculate hydrologic statistics. PeakFQ is an application based on USGS's guidelines for determining flood flow frequency (U.S. Interagency Advisory Committee on Water Data 1982), and is publicly available at USGS's PeakFQ.
USGS recommends having ten years of flow data before conducting a basic determination of event frequency. Such data might be in the form of ten consecutive annual peak flow values—that is, the highest estimated discharge for each of ten years, input as a list into the application. The Nature Conservancy also has developed software for estimating statistical indicators describing flow, and the Indicators of Hydrologic Alteration (IHA) software application and supporting information can be downloaded from The Nature Conservancy. IHA requires daily discharge data for input; refer to the IHA user's manual for additional information including data requirements (The Nature Conservancy 2006).
Hydrologic Models
The location of flow gauges along a stream may not coincide with biological sampling sites. Furthermore, data from an impaired site may not be matched with comparable reference site data. If a flow gauge is downstream of a biological sampling site, it may be appropriate to scale down flow estimates for the biological sampling site, using a ratio of watershed area between the two locations. Alternatively, a computer model characterizing a watershed's hydrologic behavior may assist causal assessment by providing data to compare with observed data, and allowing further understanding of flow regimes. Model inputs might include precipitation, watershed shape and size, infiltration rates, and lengths and roughness of flow paths. These data also may allow for simple analyses. For example, an investigator could compare the percent of total precipitation reaching stream channels among watersheds with varying amounts of impervious surface area.
Hydrologic data also may allow investigators to develop more complicated simulations that depict a range of flow characteristics. Hydrologic computer models can be used to compare pre- and post-development flow regimes, to compare reference versus impaired watershed flow characteristics, and to consider potential impacts of restoration designs. Modeling software continues to evolve as computational technology improves. For example, the U.S. EPA and the U.S Army Corps of Engineers Hydrologic Engineering Center (HEC) provide modeling applications and supporting materials (BASINS and HEC, respectively).
Conducting a hydrologic study often involves developing a map of the watershed, as hydrologic modeling frequently entails using Geographic Information Systems (GIS) to characterize watershed features. Examples of GIS components in hydrologic modeling include digital elevation models (DEMs or topography) and soil-type layers, which are sometimes made available by local government agencies. Causal assessors may search for existing hydrologic studies and models of impaired watersheds, perhaps conducted or contracted by local government agencies.
On this Page
About Conceptual Diagrams
Conceptual diagrams are used to describe hypothesized relationships among sources, stressors and biotic responses within aquatic systems.
Simple Conceptual Model Diagram
Sources or human activities affecting flow include agricultural, forestry, mining, construction, residential, commercial, recreational and industrial practices. These activities can alter both discharge patterns (i.e., watershed-scale or hydrologic variables) and local flow characteristics associated with structural habitat changes (reach-scale or hydraulic variables).Figure 2. A simple conceptual diagram, depicting pathways from sources to biological responses, for flow alteration. Click on diagram to enlarge.
These alterations occur via direct discharges into surface waters, increases in overland transport efficiency and surface runoff, decreases in groundwater and surface water inputs, and increased discharge regulation. Watershed land cover alteration, for example, often involves conversion of forested or vegetated landscapes to cleared areas or impervious surfaces, which can increase surface runoff during precipitation events and increase the magnitude and frequency of peak discharges.
Flow interacts with other causal agents. Watershed-scale flow variables such as discharge can affect ionic strength and sediment accumulation, in addition to concentrations and bioavailability of toxic compounds, metals, and nutrients. For example, higher discharges can contain high levels of metals, toxics, and ions associated with surface runoff, but higher discharges also can dilute these substances or reduce their bioavailability. Consult the Flow Alteration module for more stressor interaction examples.
To properly assess changes in flow regime, the investigator must consider multiple aspects of water flow and timing. At the watershed-scale, common alterations include changes in magnitudes, frequencies or durations of low- and/or high-flow events, increases or decreases in flow variability (daily and seasonally) and/or changes in the timing and sequencing of discharge patterns.
Parameters commonly affected at the reach-scale include changes in water depth and velocity. Watershed- and reach-scale flow alterations both can affect plant, invertebrate and fish assemblages, ultimately contributing to biological impairment of a system.
Detailed Conceptual Model Diagram
Water flow is an integral part of running water systems, and flow alteration can significantly affect all aspects of these ecosystems and ultimately lead to biological impairment. This conceptual diagram illustrates linkages between flow-related stressors (middle of diagram), the human activities and sources that can contribute to those stressors (top of diagram), and the biological responses that can result (bottom of diagram).
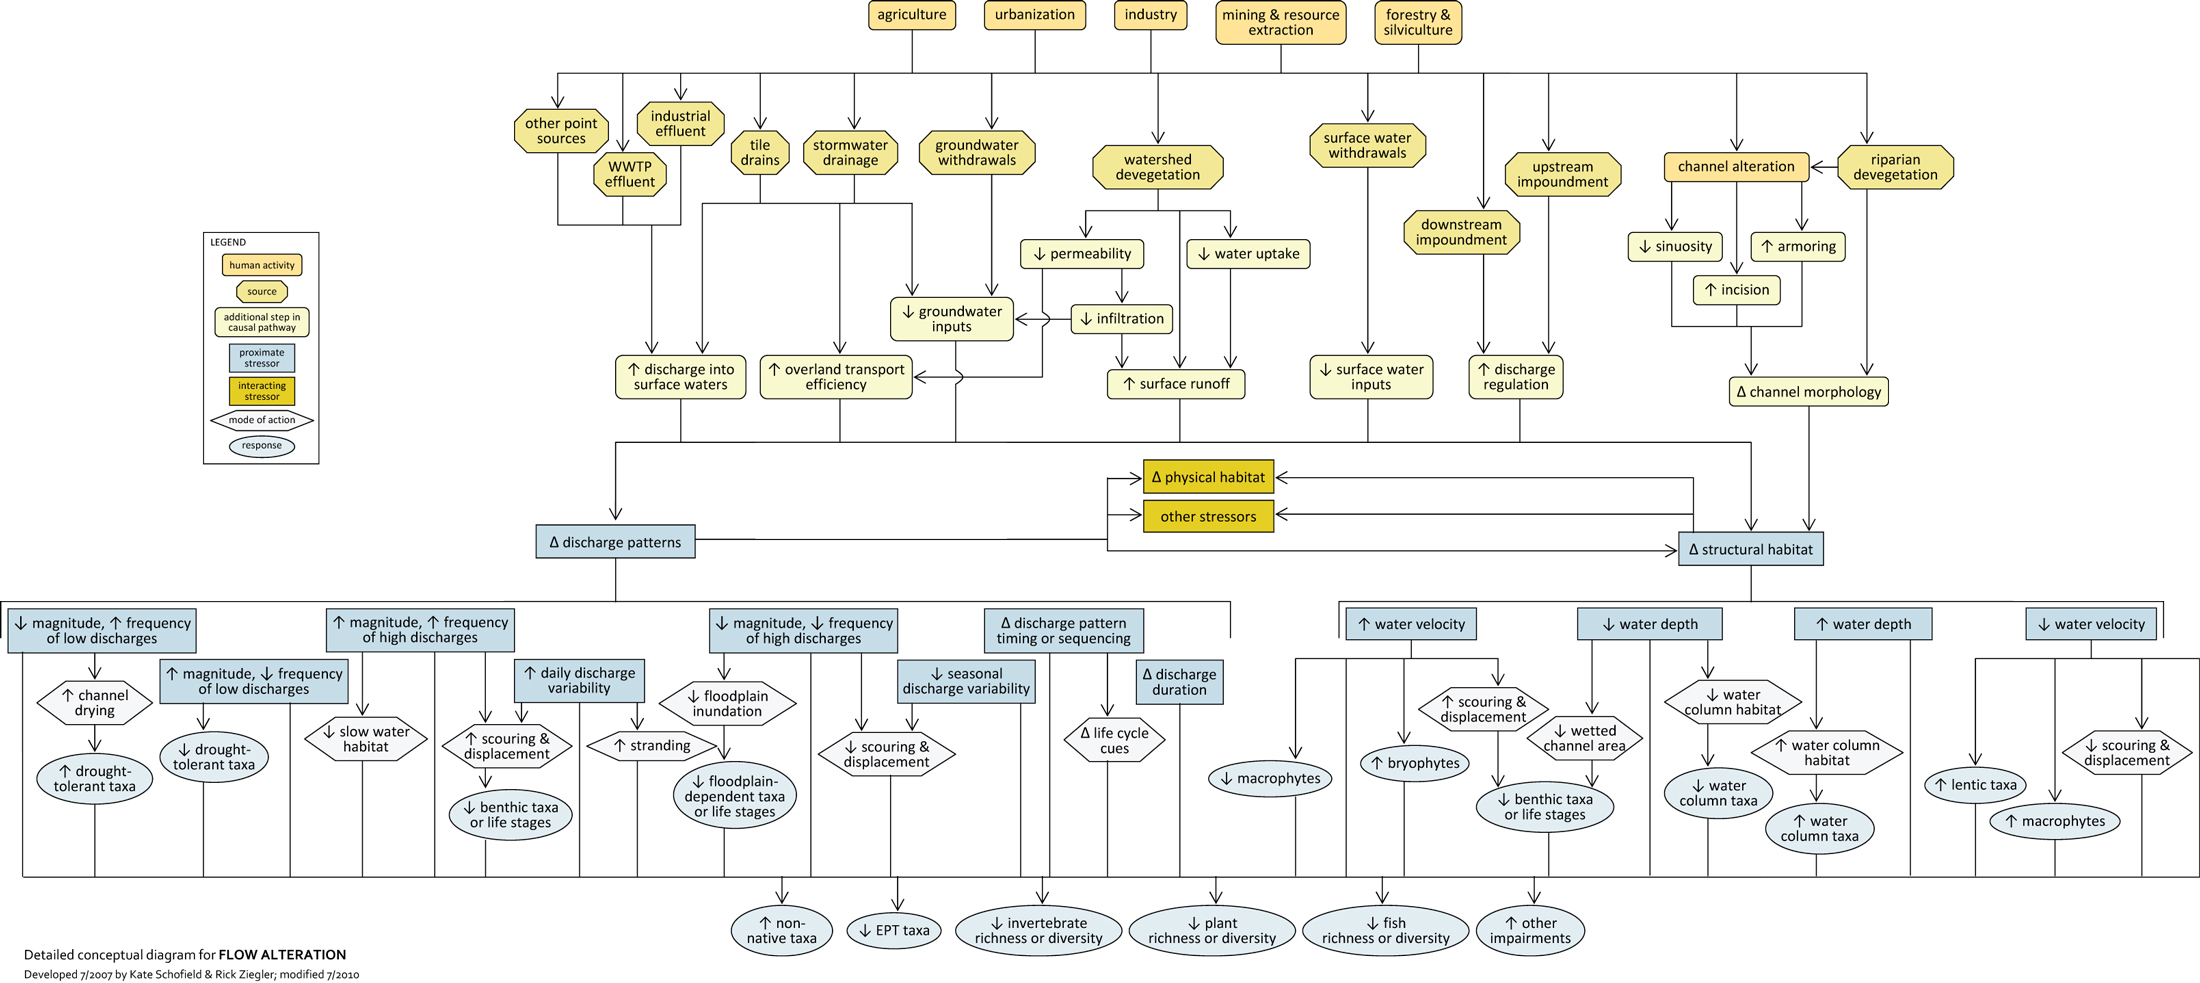
In some cases, additional steps leading from sources to stressors, modes of action leading from stressors to responses, and other modifying factors also are shown. This narrative generally follows the diagram top to bottom, left to right.
Linking Sources and Activities to Proximate Stressors
A number of common sources and human activities shown at the top of the diagram may contribute to flow alteration (i.e., the proximate stressor), broadly defined as changes in flow or discharge regime and flow-related structural habitat characteristics such as water velocity and water depth. Human activities or practices shown at the top of the diagram (agriculture, forestry, mining, etc.) may lead to:
- Point sources (including effluents), which may increase discharge
- Changes to drainage (per stormwater and agricultural tile drainage systems), which can increase the efficiency of overland flow and decrease infiltration and groundwater recharge
- Watershed land cover alteration, often resulting in flashier flow regimes marked by reduced infiltration (a common impact of impervious surfaces such as parking lots, rooftops, and compacted soils), reduced vegetative uptake, decreased baseflow, increased peak flow and increased frequency of peak flows
- Groundwater and surface water withdrawals (e.g., for irrigation), which can reduce discharge and change the surface/ groundwater interface
- Impoundments (e.g., dams, detention basins) that might be used for hydro-electric purposes or for mitigating peak flows associated with impervious surfaces, can create still water systems upstream of the impoundment or altered flow regimes downstream
- Channel geomorphology and riparian vegetation alteration, which can lead to localized flow alteration; for example, structural habitat alteration such as reduced channel sinuosity and increased incision might change flow velocity and flow depth
The above sources may result in changes in discharge patterns (watershed-scale or hydrologic flow characteristics) and changes in localized flow characteristics often associated with structural habitat changes (reach-scale or hydraulic characteristics). Additionally, changes in discharge patterns at the watershed scale may alter structural habitat and local flow patterns, thereby affecting reach-scale variables.
Both watershed- and reach-scale variables often exert a significant influence on numerous other causal agents (represented here by the rectangle in the center of the diagram, “other stressors”). For example, high discharges may decrease contaminant concentrations (e.g., for stressors such as ionic strength, metals, unspecified toxic chemicals, nutrients, and sediment) via dilution. Conversely, high discharges may be associated with high contaminant concentrations, if contaminants are washed into streams with increased surface runoff.
Stressors such as nutrients and sediment may in turn affect reach-scale variables, as accumulation of plants (often a function of increased nutrients) or sediment can alter local flow patterns. Discharge, as well as sources related to channel alteration, also may have a significant effect on structural habitat (e.g., channel geomorphology and riffle/pool structure), which may then influence reach-scale variables.
Finally, reach-scale variables such as water depth and velocity can significantly affect water temperature and dissolved oxygen concentrations; for example, faster moving, turbulent water tends to be more aerated than slow-moving, non-turbulent water. Consult the Flow Alteration module for more stressor interaction examples.
Linking Proximate Stressors to Biological Responses
Altered flow regimes in streams and rivers can cause biological impairment through a variety of mechanisms. Frequency, magnitude, and duration of both low flows (i.e., baseflows or average flows) and high flows (i.e., peak or stormflows) may change with flow alteration. For example, low flows may decrease in magnitude or increase in duration when water is withdrawn from the channel as less water may remain in the channel and low water conditions may persist for greater lengths of time.
These changes may lead to channel drying, resulting in increased abundance of drought-tolerant taxa, such as taxa that can fit their entire life cycles into periods between droughts. High flows often increase in magnitude and frequency when sources leading to increased surface runoff are present; increases in peak flows may result in increased scouring and displacement of biota, which may reduce epibenthic (i.e., living on benthic surfaces) taxa.
In contrast, other sources (e.g., flow-regulating impoundments) may reduce magnitude or frequency of high flows, which can decrease natural scouring and displacement and increase abundance of taxa with longer life cycles that tend to compete well in more benign physical environments. Decreases in frequency, magnitude or duration of high flows also may adversely affect floodplain-dependent taxa, if inundation of the floodplain is reduced.
Changes in discharge patterns also may take the form of altered flow variability. The diagram shows increased daily discharge variability (e.g., a dam regulating flow throughout the day to meet hydro-electric demands) and decreased seasonal discharge variability (e.g., a dam may stabilize outflow regardless of seasonal precipitation and/or snowmelt).
Seasonal flow stabilization may result in increases in lentic taxa more suited to slow-moving water (e.g., macrophytes), or decreases in taxa relying on discharge-related life cycle cues (e.g., timing of seasonal flow regime shifts). In contrast, increases in daily flow variability may lead to decreases in flow refugia (i.e., slower flow areas where organisms can avoid stormflows) and subsequent scouring and displacement of organisms.
Changes in discharge pattern timing or sequencing may disrupt synchrony between discharges and organism life histories. For example, high flows may serve as a trigger for spawning or migration in certain fish species; if these high flows are prevented (e.g., through regulation), or if high flows occur earlier or later in the season, the cueing and outcome of these behaviors may be altered.
At the reach scale, changes in local flow characteristics may include changes in water depth or velocity. Decreases may contribute to biological impairment by decreasing available water column habitat or by leading to increases in lentic taxa and macrophytes. Increases in water velocity and depth may increase scouring and displacement and affect biota via changes in physical habitat, leading to increases in taxa adapted to faster moving water and deeper water column habitats.
Flow alteration, as described above, may increase non-native taxa, decrease EPT taxa, and decrease invertebrate, plant, and fish richness or diversity. Such changes are often characterized as biological impairment, and may be associated with stress from flow alteration.
This section presents an annotated bibliography of references providing information on stressor-response relationships for flow alteration, as well as general background information. This is not meant to be a comprehensive bibliography of references dealing with altered flow, but rather is meant to highlight a few references that may be especially useful.
You may need a PDF reader to view some of the files on this page. See EPA’s About PDF page to learn more.
- Bunn SE, Arthington AH (2002) Basic principles and ecological consequences of altered flow regimes for aquatic biodiversity. Environmental Management 30(4):492-507.
This article covers the effects of flow alteration on physical habitat and aquatic biota. Influence of flow alteration leading to physical habitat alteration is described for fish, invertebrates, and aquatic plants. Consequences of converting lotic systems to lentic are described. Life history of aquatic species is related to flow along with impacts on populations from disruption of stream connectivity. Lastly, stream flow is connected to ability of invasive and exotic species to successfully invade.
- Newbury RW, Bates DJ (2007) Dynamics of flow. Pp. 79-102 in: Hauer RF, Lamberti GA (Eds). Methods in Stream Ecology (2nd edition). Academic Press, San Diego CA.
This chapter introduces general dynamics of flow, its impact on aquatic life, and considerations at various scales. Forces associated with flow are introduced: shear stress, boundary layers, hydraulics, and stream bed stability. Methods for site selection and hydraulic mapping are explained at the end of the chapter.
- Poff NL, Allan JD, Bain MB, Karr JR, Prestegaard KL, Richter BD, Sparks RE, Stromberg JC (1997) The natural flow regime. BioScience 47(11):769-784.
This review describes attributes of a natural flow regime and hydrologic processes. It includes sources of human alterations to natural flow regimes and their impacts, ecological functions of the natural flow regime and ecological consequences of alteration. The ecological responses to flow magnitude, frequency, timing, and duration are described. Recovery and methods for management are included.
- Richter BD, Baumgartner JV, Powell J, Braun DP (1996) A method for assessing hydrologic alteration within ecosystems. Conservation Biology 10(4):1163-1174.
This article explains the importance of a natural hydrologic flow regime to aquatic and riparian biota. Some consequences of anthropogenic flow alteration on physical habitat and stream chemistry are described, and the need to consider flow patterns over multiple years and define biologically relevant endpoints is supported. Effects and interactions of magnitude, timing, frequency, and duration are explained. A case study that assesses hydrologic alteration is included.
You may need a PDF reader to view some of the files on this page. See EPA’s About PDF page to learn more.
- Arthington AH, Bunn SE, Poff NL, Naiman RJ (2006) The challenge of providing environmental flow rules to sustain river ecosystems. Ecological Applications 16(4):1311-1318.
- Biggs BJF, Nikora VI, Snelder TH (2005) Linking scales of flow variability to lotic ecosystem structure and function. River Research and Applications 21(2-3):283-298.
- Bragg OM, Black AR, Duck RW, Rowan JS (2005) Approaching the physical-biological interface in rivers: a review of methods for ecological evaluation of flow regimes. Progress in Physical Geography 29(4):506-531.
- Bunn SE, Arthington AH (2002) Basic principles and ecological consequences of altered flow regimes for aquatic biodiversity. Environmental Management 30(4):492-507.
- Cunnane C (1978) Unbiased plotting positions: a review. Journal of Hydrology 37:205-222.
- FISRWG (1998) Federal Stream Corridor Restoration Handbook: Principles, Processes, and Practices. ExitFederal Interagency Stream Restoration Working Group (15 agencies of U.S. government). GPO Item No. 0120-A; SuDocs No. A 57.6/2:EN 3/PT.653.
- Goldstein RM, Meador MR (2004) Comparisons of fish species traits from small streams to large rivers. Transactions of the American Fisheries Society 133(4):971-983.
- Interagency Advisory Committee on Water Data (1982) Guidelines for Determining Flood Flow Frequency: Bulletin 17B of the Hydrology Subcommittee. U.S. Geological Survey, Office of Water Data Coordination, Reston VA.
- Jaag O, Ambuhl H (1964) The effect of the current on the composition of biocoenoses in flowing water streams. Advances in Water Pollution Research 1:39-49.
- Leopold LB, Wolman MG, Miller JP (1995) Fluvial Processes in Geomorphology. Dover Publications, New York NY.
- Lytle DA, Poff NL (2004) Adaptation to natural flow regimes. Trends in Ecology & Evolution 19(2):94-100.
- Newbury RW, Bates DJ (2007) Dynamics of flow. Pp. 79-102 in: Hauer RF, Lamberti GA (Eds). Methods in Stream Ecology (2nd edition). Academic Press, San Diego CA.
- Peckarsky BL, Taylor BW, Caudill CC (2000) Hydrologic and behavioral constraints on oviposition of stream insects: implications for adult dispersal. Oecologia 125:186-200.
- Poff NL, Allan JD, Bain MB, Karr JR, Prestegaard KL, Richter BD, Sparks RE, Stromberg JC (1997) The natural flow regime. BioScience 47(11):769-784.
- Poff NL, Ward JV (1989) Implications of streamflow variability and predictability for lotic community structure: a regional-analysis of streamflow patterns. Canadian Journal of Fisheries and Aquatic Sciences 46(10):1805-1818.
- Power ME, Sun A, Parker G, Dietrich WE, Wootton JT (1995) Hydraulic food-chain models. BioScience 45(3):159-167.
- Rantz SE (1982) Measurement and computation of streamflow. Volume 1: measurement of stage and discharge, Volume 2: computation of discharge. U.S. Geological Survey. Water Supply Paper 2175.
- Richter BD, Baumgartner JV, Powell J, Braun DP (1996) A method for assessing hydrologic alteration within ecosystems. Conservation Biology 10(4):1163-1174.
- Roy AH, Freeman MC, Freeman BJ, Wenger SJ, Ensign WE, Meyer JL (2005) Investigating hydrologic alteration as a mechanism of fish assemblage shifts in urbanizing streams. Journal of the North American Benthological Society 24(3):656-678.
- The Nature Conservancy (2007) Indicators of Hydrologic Alteration: Version 7 User's Manual. The Nature Conservancy.
Contacts: Author & Contributors