Ionic Strength
On this Page
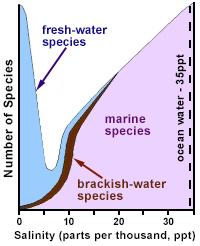 Figure 1. Generalization of species richness versus salinity. Fresh, inland surface waters usually have salinities below 0.5 parts per thousand (ppt), whereas the salinity of ocean water is approximately 35 ppt.
Redrawn and adapted from Remane (1971) and Wetzel (2001)Ionic strength is the concentration of ionic charge in solution. Increased ionic strength and changes in ionic composition may lead to shifts in community composition and function based on factors such as taxa-specific preferences.
Measurements of electrical conductivity, salinity and total dissolved solids (TDS) are often used to represent the ionic strength of water (see Ways to Measure tab). These measurements generally increase with increasing ion content. This module provides advice for deciding whether or not to include increased ionic strength as a candidate cause of biological impairment.
Because ionic strength issues include a broad range of potential freshwater problems, we are forced to generalize about overall effects. There will be exceptions to these generalizations, especially in terms of taxa-specific reactions to various ion-specific stresses. Nevertheless, this stressor module introduces a common language and identifies some of the more widespread ion-related issues. Ultimately, causal assessors may need to dig deeper into site-specific characteristics and relevant literature.
Ionic compounds are natural constituents of both inland and marine systems. These compounds are not harmful unless levels exceed or fall below the tolerance range of aquatic organisms. Indeed, some constituents of ionic compounds are essential elements, necessary for the survival of aquatic organisms. Salts are ionic compounds composed of cations (positive charge) and anions (negative charge). Common salt ions include:
- Cations: sodium (Na+), calcium (Ca2+), magnesium (Mg2+), potassium (K+)
- Anions: chloride (Cl-), bicarbonate (HCO3-), carbonate (CO32-), sulfate (SO42-)
Ionic strength varies naturally across aquatic ecosystems (Figure 1), and aquatic organisms generally prefer waters with specific ionic strength ranges, containing specific ions. When these parameters are changed, biota may be adversely affected. In recent years, several states (e.g., Florida, West Virginia) have adopted criteria which address the importance of ionic strength in determining water quality.
Ionic strength may significantly impact freshwaters through interactions with other stressors, and it may be difficult to distinguish among proximate stressors and interacting stressors. Potential interactions include:
- Increased salinity may affect the uptake of toxic substances by organisms (Bidwell and Gorrie 2006, Zalizniak et al. 2006, Environment Canada and Health Canada 2001).
- Salts impact soil structure, potentially decreasing soil permeability (Rengassamy 2002), increasing runoff volume and soil erosion (Environment Canada and Health Canada 2001).
- Salt solubility increases as temperature increases.
Salinity, along with temperature and altitude, also affects the solubility of oxygen in water. Freshwater (salinity generally < 0.5 parts per thousand) at 22°C and sea level can hold approximately 8.7 milligrams per liter (mg/L) of dissolved oxygen (DO). Ocean water (salinity ≈ 35 parts per thousand) can hold only about 7.1 mg/L of DO at saturation.
DO saturation might change by 6% over a 10 parts per thousand difference in salinity. With freshwater ecosystems generally falling below 0.5 parts per thousand, the associated DO change over the spectrum of freshwater salinity levels is negligible (Stickney 1979).
Checklist of Sources, Site Evidence and Biological Effects
This module addresses ionic strength as a proximate stressor. The concentration of hydrogen ions (pH) and heavy metal ions (e.g., lead and zinc), while related to ionic strength and composition, are discussed in separate modules.
Ionic strength should be a candidate cause when human sources and activities, site observations or biological effects support portions of the source-to-impairment pathways (Figure 2). This diagram and some of the other information also may be useful in Step 3: Evaluate Data from the Case.
The checklist below will help you identify key data and information useful for determining whether to include ionic strength among your candidate causes. The list is intended to guide you in collecting evidence to support, weaken or eliminate ionic strength as a candidate cause. For more information on specific entries, go to the When to List tab.
 Figure 2. A simple conceptual diagram illustrating causal pathways, from sources to impairments, related to ionic strength. Click on the diagram to view a larger version.Consider listing ionic strength as a candidate cause when the following sources and activities, site evidence and biological effects are present:
Sources and Activities
- Road salt
- Land cover alteration, leading to dryland salinity
- Water withdrawal
- Irrigation
- Combustion wastes
- Resource exploration and extraction (i.e., mining activities)
- Sewage and industrial waste discharges
Site Evidence
- Signs of snow disposal
- Crystalline deposits
- Mineral precipitates
- Loss of vegetation
- Presence of salt-tolerant plants
- Decreased productivity of aquatic vegetation
Biological Effects
- Unlike other stressors, “rules of thumb” for ionic strength are not listed here. See the When to List tab for common examples of potential biological effects due to changes in ionic strength.
Consider contributing, modifying and related factors as candidate causes when ionic strength is selected as a candidate cause:
- Flow alteration
- Metals
- pH
- Sediment
- Temperature
- Unspecified toxic chemicals
On this Page
- Sources and Activities that Suggest Listing Ionic Strength as a Candidate Cause
- Site Evidence that Suggests Listing Ionic Strength as a Candidate Cause
- Biological Effects that Suggest Listing Ionic Strength as a Candidate Cause
- Site Evidence that Supports Excluding Ionic Strength as a Candidate Cause
Sources and Activities that Suggest Listing Ionic Strength as a Candidate Cause
The ionic strength of surface waters is influenced by numerous human activities, in both waterbodies and their associated watersheds. The more extensive the relevant sources and activities, the more likely increased ionic strength will impair surface waters.
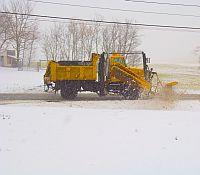 Figure 3. Utility truck applying salt to road for winter driving safety.Dissolved ions enter waterways from both point and nonpoint sources. Ion transport occurs by overland flow; evaporation and transpiration of water in shallow soil zones, which increases concentrations of dissolved ions; and infiltration through soil into groundwater, with subsequent discharge to lakes, streams and rivers. Increased ionic strength is often positively correlated with watershed urbanization. Watershed surfaces with reduced permeability (e.g., pavement) and storm drain networks transport ions efficiently to surface waters (Roy et al. 2003, Wang and Yin 1997). In addition to ion transport, concentration of ions through evaporation also may influence freshwater ionic strength. For most of the sources listed below, evaporation—due to anthropogenic activities or natural processes—might act as a step in the causal pathway.
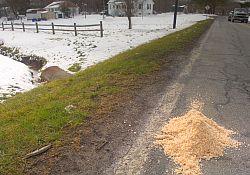 Figure 4. Application of road salt to road near stream culvert.Some soil types and geologic formations are natural sources of salts, and certain anthropogenic activities may mobilize and transport those salts to freshwater streams and rivers. Natural geologic variability among neighboring watersheds may result in profound—yet natural—differences in ionic strength of associated streams, especially in arid regions, such as the southwestern U.S. Causal assessors should characterize soil type and geology if ionic strength is being considered as a stressor, particularly if dryland salinity, mining, oil drilling, or irrigation occur in the watershed.
The atmosphere also can be a source of salts to streams and rivers. Rain, snow and wind carry salts to freshwater systems, either in solution or as dry fallout. Along with natural salt sources, the atmosphere may mobilize domestic and industrial pollution with high salt content (Wetzel 2001).
Road salt applied to icy or snowy roads (see Figures 3 and 4), road salt splashed beyond road shoulders, road salt stockpiles, and salt associated with piled waste snow may reach surface waters (Kaushel et al. 2005, Environment Canada and Health Canada 2001, Evans and Frick 2001).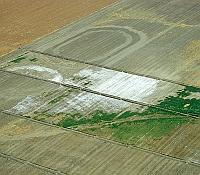 Figure 5. Dryland salinity, with salts mobilized to the ground surface in an agricultural field.
Photo courtesy of S. Bauer, USGS
Land cover alteration, such as replacement of native vegetation with shallow root-zone vegetation or vegetation with decreased rainfall interception, can raise water tables and mobilize salts, particularly in regions with naturally saline groundwater, soil or geology. Subsequently, salts may be transported to the ground surface (see Figure 5) or to surface waters via groundwater discharge, a phenomenon sometimes referred to as "dryland salinity" (Rengassamy 2006, National Land and Water Resources Audit 2001).
Water withdrawal for human consumption or irrigation may reduce dilution of dissolved ions in surface waters, thereby increasing ionic concentration. Groundwater withdrawal in coastal areas may cause saltwater intrusion, whereby dissolved ions from marine sources reach otherwise freshwater aquifers. In turn, ions may reach surface waters by mechanisms related to land cover alteration (see above).
Irrigation may mobilize salts by mechanisms similar to the dryland salinity process described earlier. Additionally, irrigation water with high salt content may be introduced to watersheds and reach surface waters by overland flow.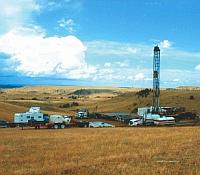 Figure 6. Streamside coal bed methane mining and related groundwater extraction.
Courtesy of S. Bauer, USGS
Combustion effluents produced during or mobilized for coal, oil, or wood combustion, including cooling wastewater (blowdown) and ash sluice water, may have elevated ionic content.
Resource exploration and extraction can disturb geologic substrates and mobilize leachable minerals. Improperly cased oil wells may allow mobilization of saline waters (Pond 2004). Waters produced by or used in oil and gas development, mine dewatering, and related activities (e.g., coal bed methane mining; Figure 6), may be saline (Clark et al. 2001).
Sewage and industrial waste discharges often have higher ionic concentrations than receiving freshwaters, as modern wastewater treatment systems are not always equipped to reduce ionic content prior to discharge.
Site Evidence that Suggests Listing Ionic Strength as a Candidate Cause
- Signs of snow disposal into or near surface waters
- Crystalline deposits on channel surfaces such as banks, rocks, culverts and drains
- Mineral precipitates appearing as floc, substrate discoloration or cemented organic debris (Figure 7)
- Loss of vegetation including, for example, macrophytes or riparian trees (Williams 2001)
- Presence of salt-tolerant plants such as salt cedar
- Decreased productivity of aquatic vegetation often associated with wilting, bleaching or loss of color and/or stunted growth
Biological Effects that Suggest Listing Ionic Strength as a Candidate Cause
There is debate among scientists as to the exact mechanisms responsible for toxicity associated with ionic strength. Toxicity due to ionic strength could result from disruption of organisms' osmotic regulation processes, decreases in bioavailability of essential elements, increases in availability of heavy metal ions, increases in particularly harmful ions, changes in ionic composition, absence of chemical constituents that offset impacts of harmful ions, a combination of the above, or other as yet unknown mechanisms.
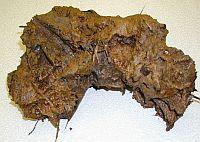 Figure 7. Leaf pack from an ion-rich aquatic habitat, showing leaves cemented to one another by minerals.In some instances (perhaps the majority), increased ionic strength causes shifts in community composition rather than mortality. Thus, specific conductivity, salinity and TDS levels may be associated with biological impairment and yet be below mortality thresholds.
Toxicity due to ionic strength and composition is often site-specific, species-specific and ion-specific. Horrigan et al. (2005, 2007) developed a numerical salinity index based on the presence/absence of salt sensitive and tolerant macroinvertebrate families. 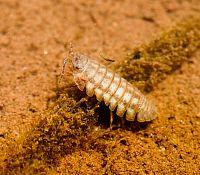 Figure 8. Isopod. Isopoda is an order of crustaceans that includes woodlice and their relatives. Isopods live in the sea, in fresh water, or on land. All have rigid, segmented exoskeletons and most are grayish or whitish in color.Additionally, Table 1 (below) lists examples of potential biological effects due to changes in ionic strength.
These examples do not apply to all situations. Rather, they provide examples of what causal assessors may find in site-specific biological monitoring data and the type of information that might be found in the literature. Organisms listed in the table are primarily macroinvertebrates. Note that exceptions may exist for many of the summary statements listed below. For example, some amphipods may benefit from slightly increased levels of salinity, but this would depend on ionic composition and the specific taxa present. Before using these generalizations in specific causal assessment tasks, be sure to become familiar with the context of each study.
| Organism | Effect |
|---|---|
| Caecidotea and Tipula | Presence associated with elevated conductivity typical of agricultural and urbanized areas (Black et al. 2004) |
| Ceratopogonidae and Tipulidae | Presence in spring-fed surface waters associated with elevated chloride levels attributed to road salt application (Williams et al. 1997) |
| Chlorophyta | Green filamentous alga Cladophora glomerata reported to have affinity for calcium cations (Sikes 1978) |
| Ephemerellidae and Perlidae | Dominance associated with low conductivity typical of forested sites (Black et al. 2004) |
| Gammarus pseudolimnaeus and Turbellaria | Presence in spring-fed surface waters associated with low chloride levels (Williams et al. 1997) |
| Halophilic diatoms | Some diatoms (e.g., Entomoneis) observed to increase with elevated salinity |
| Macrocrustaceans | Amphipods, decapods and isopods (see Figure 8) with high acute lethal salinity tolerance relative to other freshwater taxa (Kefford et al. 2003); amphipods with optima at elevated conductivity levels (Black et al. 2004) |
| Mayflies | Ephemeroptera declined along gradient of increasing conductivity (Pond 2004); some baetid mayflies with low acute lethal salinity tolerance relative to other freshwater taxa (Hassell et al. 2006, Kefford et al. 2003) |
| Orthocladiinae midges (brine- or shoreflies) | Increased with ionic strength in multiple U.S. datasets |
| Soft-bodied non-arthropods | Non-arthropod freshwater macroinvertebrates with soft-bodies (certain Oligochaeta, Gastropoda, Nematomorpha, Tricladida, and Hirudinea) with lower acute lethal salinity tolerance than other freshwater taxa, potentially due to increased permeability to dissolved ions (Kefford et al. 2003) |
Site Evidence that Supports Excluding Ionic Strength as a Candidate Cause
There are no site observations that specifically provide evidence of the absence of changes in ionic composition. General reasons for excluding a candidate cause from the list are described in Step 2 of the Step-by-Step Guide and in Tips for Listing Candidate Causes.
We strongly caution against using effects benchmarks (e.g., water quality criteria) as evidence for excluding ionic strength from your initial list of candidate causes. This is because different species have different ionic strength requirements, and different sites have different naturally occurring levels of ionic strength.
Ionic strength is a function of concentration and charge of all ions in a given solution (see Equation 1). Direct measurement of ionic strength is seldom used in ecological studies. Causal assessors are more likely to have access to measures which generally correlate with ionic strength.
-
Electrical conductivity or conductance: Ability of a solution to conduct current (measured in microsiemens per centimeter (μS/cm), millisiemens per centimeter (mS/cm), micromhos per centimeter (μmho/cm), or millimhos per centimeter (mmho/cm), which is related to ionic strength, temperature, and the mobility of ions. One siemen (S) is equal to one mho, and these terms are used interchangeably. "Specific conductivity" indicates the measurement has been normalized to a reference temperature (usually 25°C). Conductivity increases approximately 2% for every 1°C increase in water temperature (Wetzel 2001).

- Salinity: Salt content of water (measured in mg/L, grams per liter (g/L), or parts per thousand); parts per thousand can be interpreted as salt mass per 1000 units of water mass, or grams of salt per 1000 grams of water.
- Total dissolved solids (TDS): Concentration of material dissolved in water (measured in mg/L, g/L, or parts per thousand).
Conductivity, salinity and TDS do not fully account for variance in toxicity due to individual ions or ionic composition [refer to Mount et al. (1987) for more information on individual ions and related toxicity], especially for sub-lethal endpoints (Zalizniak et al. 2006). Different solutions with the same ionic strength, conductivity, salinity and TDS may have different effective toxicities, specific to different organisms, if ionic compositions vary. Nevertheless, conductivity, salinity, and TDS may be useful measures of ionic strength, especially in the context of acute toxicity.
In some cases, it may be appropriate to use evidence regarding individual ions (e.g., chloride) if measurements are available and reliable for a particular study site, if the individual ion is a potential causal agent (i.e., concentrations of other ions are low relative to their toxicities), or if regional information describes potential biological effects as a function of exposure to that specific ion.
On this Page
About Conceptual Diagrams
Conceptual diagrams are used to describe hypothesized relationships among sources, stressors and biotic responses within aquatic systems.
Simple Conceptual Model Diagram
Figure 2. A simple conceptual diagram illustrating causal pathways, from sources to impairments, related to ionic strength. Click on the diagram to view a larger version.Geologic and natural sources of ions, in combination with human activities (e.g., agricultural, resource extraction and industrial practices), can contribute to changes in the ion content of streams and rivers. Human activities can increase ionic strength either directly (i.e., introducing new ions) or indirectly (i.e., decreasing ion uptake in watershed, increasing ion delivery to freshwater systems).
For example, industrial, residential and commercial activities may lead to direct discharges of ion-rich waters to surface water, via industrial or wastewater treatment plant effluents. These activities also are associated with increased impervious surfaces, which can lead to increased ion delivery to surface waters.
Direct and indirect pathways (see Figure 9) both may result in increased ion content of surface runoff, subsurface waters, or particles, and ultimately change the ion content of streams and rivers. Groundwater withdrawals near coastal areas may increase the ion content of subsurface water through saltwater intrusion. Activities that increase ion-rich groundwater inputs to freshwater systems (e.g., irrigation) also may change the ion content of receiving waters.
Ion content is related to several other potential stressors, including temperature, sediment, pH, metals, other toxic chemicals and flow alteration. For example, bioavailability of toxic metals can vary with ionic strength, and decreases in pH affect total ionic strength and ionic composition. These potential interactions among stressors should be considered when ionic strength is a possible cause of impairment.
Changes in ions within freshwater systems may affect biota via changes in total ionic strength or ionic composition. Although ionic strength may decrease due to human influences (e.g., downstream of dilute industrial discharges), most often it rises with human activity.
Elevated ionic strength, or large fluctuations in ionic strength over relatively short time periods, may affect freshwater biota via several mechanisms, including increased osmotic stress and increased competition for gill binding sites. For example, changes in ionic composition may adversely impact biota toxic ions become more abundant.
Detailed Conceptual Model Diagram
Changes in ionic strength and composition may benefit some aquatic organisms while harming others, ultimately changing organism community composition. This conceptual diagram (See Figure 10) illustrates linkages between ionic strength-related stressors (middle of diagram), the human activities and sources that can affect those stressors (top of diagram), and the biological responses that can result (bottom of diagram).
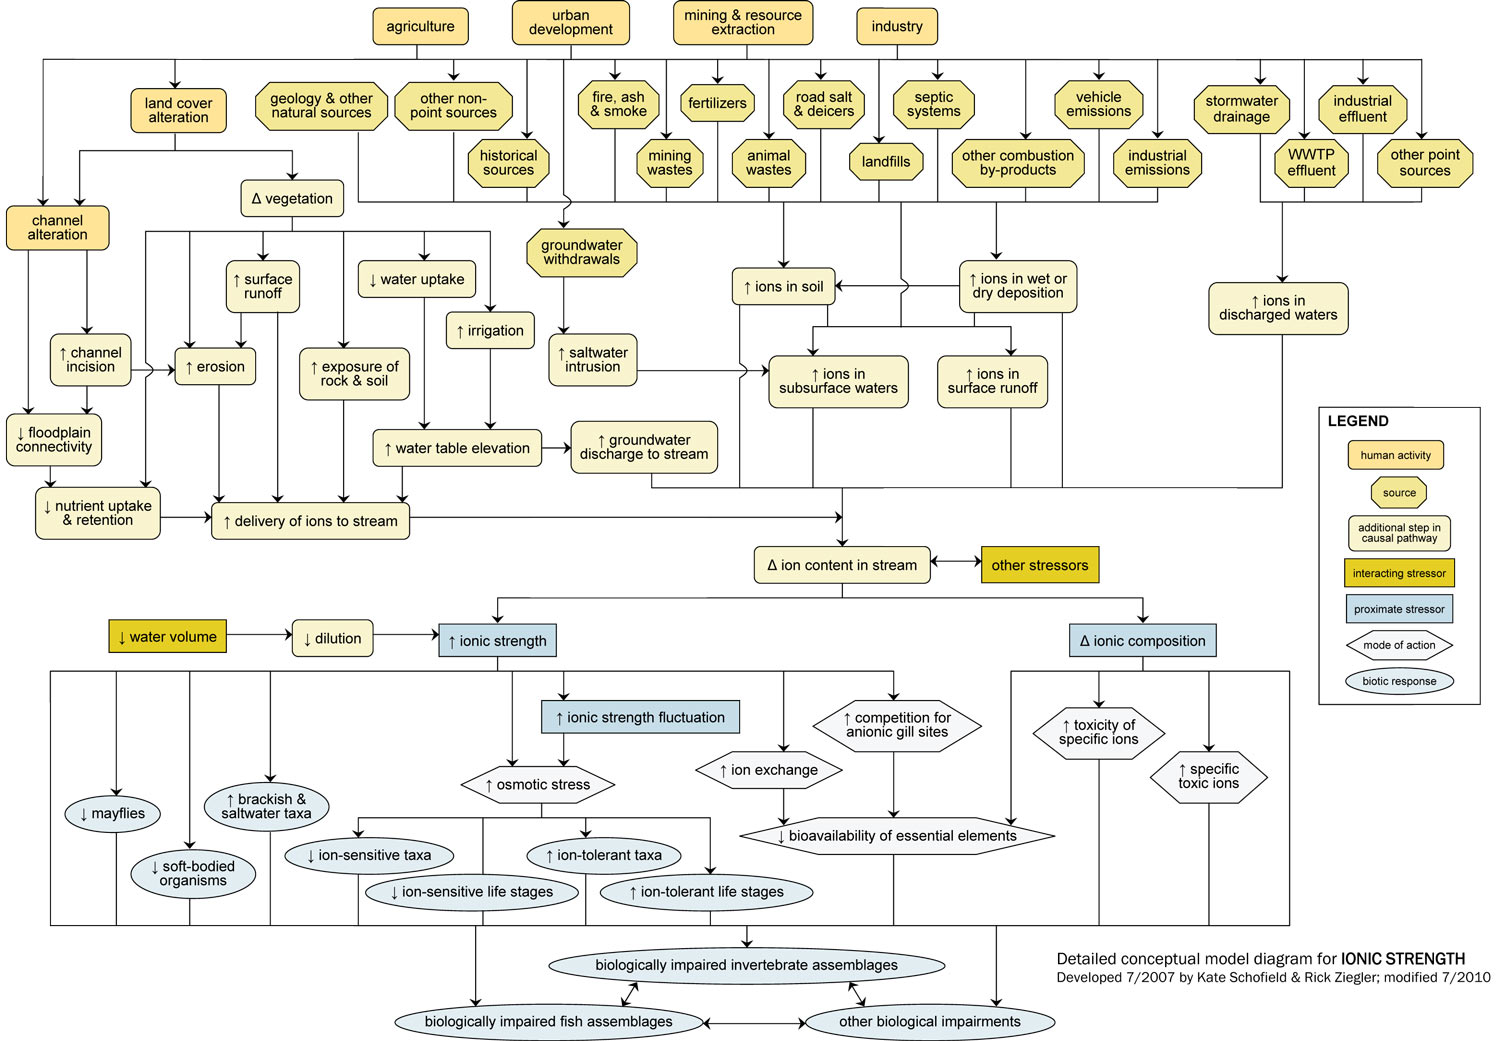
In some cases, additional steps leading from sources to stressors, modes of action leading from stressors to responses, and other modifying factors also are shown. This narrative generally follows the diagram top to bottom, left to right.
Linking Sources to Proximate Stressors
A number of common sources and human activities may contribute to ionic strength as a proximate stressor, broadly defined as increased total ionic strength or altered ionic composition. Contributing landscape changes (e.g., channel alteration and water withdrawal), natural geologic characteristics, and human activities generally work in combination to effect changes in ionic strength and composition of surface waters.
Most sources are associated with release of wastes from agricultural, resource exploration and extraction, residential, commercial, industrial, and recreational practices. Sources that may have elevated ion content or potentially toxic ionic components include animal wastes, fertilizers, combustion by-products (e.g., cooling water), landfill and septic leachates, road salts and deicing agents, industrial and waste water treatment plant effluents, and mining wastes (e.g., tailings and co-produced water from oil drilling and coal bed methane mining processes).
These waste products may increase ions in subsurface waters, ions adsorbed to particles, and ions in watershed runoff, all of which may ultimately reach surface waters; they also may be discharged directly to streams and rivers. For example, winter safety activities may involve salting paved surfaces and then plowing ion-rich snow into riparian areas, where it melts and carries ions to surface waters.
Human activities may be associated with releases of ion-rich wastes, as described above, or land cover alterations that indirectly alter ionic strength and composition. For example, changes in vegetation or increases in impervious surfaces can increase delivery of ions to streams, via increased deposition and surface runoff. Decreased watershed vegetation may lead to increased soil and bank erosion and decreased nutrient uptake. These impacts may result in increased ion delivery to surface waters via runoff, sediment particles, or subsurface flows.
In addition, mining and other land clearing activities may expose geologic substrates, providing another terrestrial source of ions for surface waters. Groundwater withdrawal in coastal regions may increase the ion content of subsurface water due to saltwater intrusion. Agricultural practices such as planting shallow-rooted vegetation and irrigating crops may raise groundwater table elevations, thereby mobilizing ions which may reach surface waters; this process is sometimes referred to as “dryland salinity.”
Ion content of streams and rivers is related to several other potential stressors, including temperature, sediment, pH, metals, other toxic chemicals, and flow alteration. For example, salt solubility increases as temperature increases; salts can alter soil structure and potentially increase soil erosion (sediment); pH and the bioavailability of toxic substances may vary with ionic strength. Potential interactions among stressors should be considered when ionic strength is a possible cause of impairment.
Linking Proximate Stressors to Biological Impairment
The diagram shows human activities and sources ultimately contributing to two proximate stressors: increases in total ionic strength and changes in ionic composition. Although ionic strength may decrease due to human influences in certain cases (e.g., downstream of dilute industrial discharges), ionic strength most often tends to increase with human activity.
Even though organisms may be capable of handling gradual increases in ionic strength, rapid fluctuations may be harmful and are considered an additional proximate stressor under increased ionic strength.
There is debate among scientists as to the exact mechanisms responsible for toxicity associated with ionic strength, but evidence appears to indicate that elevated ionic strength, or large fluctuations in ionic strength over relatively short time periods, may affect freshwater biota via several modes of action including osmotic stress, increased competition for gill binding sites, and increased ion exchange.
Documented biological responses to ionic strength-related proximate stressors include increased abundance of certain brackish, saltwater, or ion-tolerant taxa (including amphipods, decapods, and isopods) and decreased abundance of certain ion-sensitive taxa such as mayflies and soft-bodied organisms. However, biological responses frequently are site- and species-specific and do not apply to all situations.
Common mechanisms by which changes in ionic composition may adversely impact biota include increased concentration of toxic ions or changes in the toxicity of specific ions. These compositional changes have been associated with decreased bioavailability of essential elements (e.g., magnesium) and with changes in biotic assemblages.
You may need a PDF reader to view some of the files on this page. See EPA’s About PDF page to learn more.
- Andersen CB, Lewis GP, Sargent KA (2004) Influence of wastewater-treatment effluent on concentrations and fluxes of solutes in the Bush River, South Carolina, during extreme drought conditions. Environmental Geosciences 11(1):28-41.
- APHA (American Public Health Association); AWWA (American Water Works Association); WEF (Water Environment Federation) (1998) Standard Methods for the Examination of Water and Wastewater (20th edition). American Public Health Association, Washington DC.
- Barlow PM, Reichard EG (2010) Saltwater intrusion in coastal regions of North America. Hydrogeology Journal 18(1):247-260.
- Bidwell JR, Gorrie JR (2006) The influence of salinity on metal uptake and effects in the midge Chironomus maddeni. Environmental Pollution 139:206-213.
- Black RW, Munn MD, Plotnikoff RW (2004) Using macroinvertebrates to identify biota-land cover optima at multiple scales in the Pacific Northwest, USA. Journal of the North American Benthological Society 23:340-362.
- Blackman WC, Rouse JV, Schillinger GR, Shafer WH (1973) Mineral pollution in the Colorado River basin. Journal of the Water Pollution Control Federation 45(7):1517-1557.
- Blasius BJ, Merritt RW (2002) Field and laboratory investigations on the effects of road salt (NaCl) on stream macroinvertebrate communities. Environmental Pollution 120:219-231.
- Blinn DW, Bailey PCE (2001) Land-use influence on stream water quality and diatom communities in Victoria, Australia: a response to secondary salinization. Hydrobiologia 466(1-3):231-244.
- Boelter, A. M.; Lamming, F. N.; Farag, A. M.; Bergman, H. L. (1992) Environmental effects of saline oil-field discharges on surface waters. Environmental Toxicology and Chemistry 11(8):1187-1195.
- Bradley TJ (2009) Animal Osmoregulation. Oxford University Press, New York NY.
- Brinck EL, Drever JI, Frost CD (2008) The geochemical evolution of water coproduced with coalbed natural gas in the Power River basin, Wyoming. Environmental Geosciences 15(4):153-171.
- Brix KV, Gerdes R, Grosell M (2010) Thiocyanate, calcium and sulfate as causes of toxicity to Ceriodaphnia dubia in a hard rock mining effluent. Ecotoxicology and Environmental Safety 73(7):1646-1652.
- Chafin DT (2003) Effect of the Paradox Valley Unit on the Dissolved Solids Load of the Dolores River near Bedrock, Colorado, 1988-2001. U.S. Geological Survey, Grand Junction CO. Water Resources Investigation Report 02-4275.
- Clark ML, Miller KA, Brooks MH (2001) U.S. Geological Survey Monitoring of Powder River Basin Stream-Water Quantity and Quality. U.S. Geological Survey, Cheyenne WY. Water-Resources Investigations Report 01-4279.
- Clements WH, Arnold JL, Koel TM, Daley R, Jean C (2011) Responses of benthic macroinvertebrate communities to natural geothermal discharges in Yellowstone National Park, USA. Aquatic Ecology 45(1):137-149.
- Dahm KG, Guerra KL, Xu P, Drewes JE (2011) Composite geochemical database for coalbed methane produced water quality in the Rocky Mountain region. Environmental Science & Technology 45(18):7655-7663.
- Doeg, TJ, Milledge, GA (1991) Effect of experimentally increasing concentrations of suspended sediment on macroinvertebrate drift. Australian Journal of Marine and Freshwater Research 42:519-526.
- Duncan RA, Bethune MG, Thayalakumaran T, Christen EW, McMahon TA (2008) Management of salt mobilisation in the irrigated landscape - A review of selected irrigation regions. Journal of Hydrology 351(1-2):238-252.
- Echols BS, Currie RJ, Cherry DS (2009) Influence of conductivity dissipation on benthic macroinvertebrates in the North Fork Holston River, Virginia downstream of a point source brine discharge during severe low-flow conditions. Human and Ecological Risk Assessment 15(1):170-184.
- El-Ashry MT, Vanschilfgaarde J, Schiffman S (1985) Salinity pollution from irrigated agriculture. Journal of Soil and Water Conservation 40(1):48-52.
- Entrekin S, Evans-White M, Johnson B, Hagenbuch E (2011) Rapid expansion of natural gas development poses a threat to surface waters. Frontiers in Ecology and the Environment 9(9):503-511.
- Environment Canada and Health Canada (2001) Priority Substances List Assessment Report: Road Salts. Exit Environment Canada and Health Canada.[Archived]
- Evans M, Frick C (2001) The effects of road salts on aquatic ecosystems. National Water Research Institute (NWRI), Saskatoon, Saskatchewan. NWRI Contribution No. 02-308.
- Farag AM, Harper DD (Eds) (2012) The potential effects of sodium bicarbonate, a major constituent from coal-bed natural gas production, on aquatic life. U.S. Geological Survey, Reston VA. Scientific Investigations Report 2012-5008.
- Florida DEP (Department of Environmental Protection) (2011) Surface Water Quality Standards.Exit Florida Department of Environmental Protection, Florida Regulations, Division 62, Chapter 62-302.
- Forman RTT, Alexander LE (1998) Roads and their major ecological effects. Annual Review of Ecology and Systematics 29:207-231.
- Gaiser EE, McCormick PV, Hagerthey SE, Gottlieb AD (2011) Landscape patterns of periphyton in the Florida Everglades. Critical Reviews in Environmental Science and Technology 41:92-120.
- Godwin KS, Hafner SD, Buff MF (2003) Long-term trends in sodium and chloride in the Mohawk River, New York: the effect of fifty years of road-salt application. Environmental Pollution 124(2):273-281.
- Gregory KB, Vidic RD, Dzombak DA (2011) Water management challenges associated with the production of shale gas by hydraulic fracturing. Elements 7(3):181-186.
- Griffith MB, Norton SB, Alexander LC, Pollard AI, LeDuc SD (2012) The effects of mountaintop mines and valley fills on the physicochemical quality of stream ecosystems in the central Appalachians: A review. Science of the Total Environment 417:1-12.
- Hassell KL, Kefford BJ, Nugegoda D (2006) Sub-lethal and chronic lethal salinity tolerance of three freshwater insects: Cloeon sp. and Centroptilum sp. (Ephemeroptera: Baetidae) and Chironomus sp. (Diptera: Chironomidae). Journal of Experimental Biology 209:4024-4032.
- Horrigan N, Choy C, Marshall J, Recknagel F (2005) Response of stream macroinvertebrates to changes in salinity and development of a salinity index. Marine and Freshwater Research 56:825-833.
- Horrigan N, Dunlop JE, Kefford BJ (2007) Acute toxicity largely reflects the salinity sensitivity of stream macroinvertebrates derived using field distributions. Marine and Freshwater Research 58:178-186.
- IUPAC (International Union of Pure and Applied Chemistry) (1993) Quantities, Units and Symbols in Physical Chemistry (2nd edition). Blackwell Scientific, Oxford UK.
- Jackson RB, Jobbagy EG (2005) From icy roads to salty streams. Proceedings of the National Academy of Sciences of the United States of America 102(41):14487-14488.
- Jackson RE, Reddy KJ (2007) Geochemistry of coalbed natural gas (CBNG) produced water in Powder River basin, Wyoming: Salinity and sodicity. Water Air and Soil Pollution 184(1-4):49-61.
- Kaushal SS, Groffman PM, Likens GE, Belt KT, Stack WP, Kelly VR, Band LE, Fisher GT (2005) Increased salinization of fresh water in the northeastern United States. Proceedings of the National Academy of Sciences USA 102:13517-13520.
- Kefford BJ, Papas PJ, Nugegoda D (2003) Relative salinity tolerance of macroinvertebrates from the Barwon River, Victoria, Australia. Marine and Freshwater Research 54:755-765.
- Lee DS, Herman JD, Elsworth D, Kim HT, Lee HS (2011) A critical evaluation of unconventional gas recovery from the Marcellus Shale, northeastern United States. KSCE Journal of Civil Engineering 15(4):679-687.
- Lefebvre O, Moletta R (2006) Treatment of organic pollution in industrial saline wastewater: A literature review. Water Research 40(20):3671-3682.
- Leland HV, Brown LR, Mueller DK (2001) Distribution of algae in the San Joaquin River, California, in relation to nutrient supply, salinity and other environmental factors. Freshwater Biology 46(9):1139-1167.
- Mao ZC, Shen HT, Liu JT, Eisma D (2001) Types of saltwater intrusion of the Changjiang Estuary. Science in China Series B-Chemistry 44:150-157.
- Meyer JS, Sanchez DA, Brookman JA, McWhorter DB, Bergman HL (1985) Chemistry and aquatic toxicity of raw oil shale leachates from Piceance Basin, Colorado. Environmental Toxicology and Chemistry 4(4):559-572.
- Mount DR, Gulley DD, Hockett JR, Garrison TD, Evans JM (1997) Statistical models to predict the toxicity of major ions to Ceriodaphnia dubia, Daphnia magna and Pimephales promelas (fathead minnows). Environmental Management 16:2009-2019.
- Mulrennan ME, Woodroffe CD (1998) Saltwater intrusion into the coastal plains of the Lower Mary River, Northern Territory, Australia. Journal of Environmental Management 54(3):169-188.
- National Land Water Resources Audit (2001) Australian Dryland Salinity Assessment 2000: Extent, Impacts, Processes, Monitoring and Management Options.Exit Land and Water Australia, Commonwealth of Australia.
- National Research Council (2010) Management and Effects of Coalbed Methane Produced Water in the Western United States. The National Academies Press, Washington DC.
- New York DOC (Department of Conservation) (1999) Part 703: Surface Water and Groundwater Quality Standards and Groundwater Effluent Limitations.ExitNew York Department of Conservation, Division of Water, Regulations and Enforcement.
- Novotny EV, Murphy D, Stefan HG (2008) Increase of urban lake salinity by road deicing salt. Science of the Total Environment 406(1-2):131-144.
- Ohio EPA (Environmental Protection Agency) (2014) OAC Chapter 3745-1, Water Quality Standards.Exit Ohio Environmental Protection Agency, Division of Surface Water, Columbus OH.
- Panno SV, Hackley KC, Hwang HH, Greenberg S, Krapac IG, Landsberger S, O'Kelly DJ (2005) Database for the Characterization and Identification of Sources of Sodium and Chloride in Natural Waters of Illinois. Illinois Department of Natural Resources, Illinois State Geological Survey, Champaign IL. Open File Series 2005-1.
- Paul MJ, Meyer JL (2001) Streams in the urban landscape. Annual Review of Ecology and Systematics 32:333-365.
- Peck AJ (1978) Salinization of non-irrigated soils and associated streams: a review. Australian Journal of Soil Research 16(2):157-168.
- Pelis RM, Zydlewski J, McCormick SD (2001) Gill Na+-K+-2Cl- cotransporter abundance and location in Atlantic salmon: effects of seawater and smoltings. American Journal of Physiology-Regulatory Integrative and Comparative Physiology 280(6):R1844-R1852.
- Pettyjohn WA (1971) Water pollution by oil-field brines and related industrial wastes in Ohio. Ohio Journal of Science 71(5):257-269.
- Phillips FM, Mills S, Hendricks MH, Hogan J (2003) Environmental tracers applied to quantifying causes of salinity in arid-region rivers: results from the Rio Grande basin, southwestern USA. Pp. 327-334 in: Alsharhan AS, Wood WW (Eds). Water Resources Perspectives: Evaluation, Management and Policy. Elsevier Science, Amsterdam, The Netherlands.
- Pond GJ (2004) Effects of surface mining and residential land use on headwater stream biotic integrity in the eastern Kentucky coalfield region. Kentucky Department for Environmental Protection, Division of Water, Frankfurt KY.
- Pond GJ (2010) Patterns of Ephemeroptera taxa loss in Appalachian headwater streams (Kentucky, USA). Hydrobiologia 641(1):185-201.
- Pond GJ, Passmore ME, Borsuk FA, Reynolds L, Rose CJ (2008) Downstream effects of mountaintop coal mining: comparing biological conditions using family- and genus-level macroinvertebrate bioassessment tools. Journal of the North American Benthological Society 27(3):717-737.
- Ramakrishna DM, Viraraghavan T (2005) Environmental impact of chemical deicers - A review. Water Air and Soil Pollution 166(1-4):49-63.
- Remane A (1971) Ecology of brackish water. Pp. 1-210 in: Remane A, Schlieper C (Eds). Biology of Brackish Water. John Wiley and Sons, New York NY.
- Rengasamy P (2002) Transient salinity and subsoil constraints to dryland farming in Australian sodic soil: an overview. Australian Journal of Experimental Agriculture 42:351-361.
- Rengasamy P (2006) World salinization with emphasis on Australia. Journal of Experimental Botany 57:1017-1023.
- Rice CA, Ellis MS, Bullock JH Jr. (2000) Water co-produced with coalbed methane in the Powder River basin, Wyoming: Preliminary compositional data. U.S. Geological Survey, Denver CO. USGS Open-File Report 00-372.
- Rose S (2007) The effects of urbanization on the hydrochemistry of base flow within the Chattahoochee River Basin (Georgia, USA). Journal of Hydrology 341(1-2):42-54.
- Roy AH, Rosemond AD, Leigh DS, Paul MJ, Wallace JB (2003) Habitat-specific responses of stream insects to land cover disturbance: biological consequences and monitoring implications. Journal of the North American Benthological Society 22(2):292-307.
- Sasai S, Kaneko T, Hasegawa S, Tsukamoto K (1998) Morphological alteration in two types of gill chloride cells in Japanese eels (Anguilla japonica) during catadromous migration. Canadian Journal of Zoology 76(8):1480-1487.
- Sauer TC, Costa HJ, Brown JS, Ward TJ (1997) Toxicity identification evaluations of produced-water effluents. Environmental Toxicology and Chemistry 16(10):2020-2028.
- Scanlon BR, Stonestrom DA, Reedy RC, Leaney FW, Gates J, Cresswell RG (2009) Inventories and mobilization of unsaturated zone sulfate, fluoride, and chloride related to land use change in semiarid regions, southwestern United States and Australia. Water Resources Research 45:W00A18-W00A18.
- Sikes CS (1978) Calcification and cation sorption of Cladophora glomerata (Chlorophyta). Journal of Phycology 14:325-329.
- Silver P, Rupprecht SM, Stauffer MF (2009) Temperature-dependent effects of road deicing salt on chironomid larvae. Wetlands 29(3):942-951.
- Spechler RM (1994 Saltwater intrusion and quality of water in the Floridian Aquifer system, northeastern Florida. U.S. Geological Survey, Tallahassee FL. Water Resources Investigations Report 92-4174.
- Stewart MA, Bhatt TN, Fennema RJ, Fitterman DV (2002) The road to Flamingo: An evolution of flow pattern alterations and salinity intrusion into the Lower Glades, Everglades National Park. U.S. Geological Survey. USGS Open-File Report 02-59.
- Stickney RR (1979) Principles of Warmwater Aquaculture. John Wiley and Sons, New York NY.
- Suarez DL, Wood JD, Lesch SM (2006) Effect of SAR on water infiltration under a sequential rain-irrigation management system. Agricultural Water Management 86(1-2):150-164.
- Uchida K, Kaneko T, Yamaguchi A, Ogasawara T, Hirano T (1997) Reduced hypoosmoregulatory ability and alteration in gill chloride cell distribution in mature chum salmon (Oncorhynchus keta) migrating upstream for spawning. Marine Biology 129(2):247-253.
- U.S. EPA (Environmental Protection Agency) (2011a) A field-based aquatic life benchmark for conductivity in central Appalachian streams. U.S. Environmental Protection Agency, Office of Research and Development, National Center for Environmental Assessment, Washington DC. EPA/600/R-10/023F.
- U.S. EPA (Environmental Protection Agency) (2011b) The effects of mountaintop mines and valley fills on aquatic ecosystems of the Central Appalachian Coalfields. U.S. Environmental Protection Agency, Office of Research and Development, National Center for Environmental Assessment, Washington DC. EPA/600/R-09/138F.
- Veil JA, Puder MG, Elcock D, Redweik RJ Jr. (2004) A White Paper Describing Produced Water From Production of Crude Oil, Natural Gas, and Coal Bed Methane. Prepared for the U.S. Department of Energy, Washington DC by the Argonne National Laboratory, Argonne IL.
- Wang XH, Yin ZY (1997) Using GIS to assess the relationship between land use and water quality at a watershed level. Environment International 23:103-114.
- Werner AD, Simmons CT (2009) Impact of sea-level rise on sea water intrusion in coastal aquifers. Ground Water 47(2):197-204.
- Wetzel RG (2001) Limnology (3rd edition). Academic Press, San Diego CA.
- Williams DD, Williams NE, Cao Y (1997) Spatial differences in macroinvertebrate community structure in springs in Southeastern Ontario in relation to their chemical and physical environments. Canadian Journal of Zoology 75:1404-1414.
- Williams WD (2001) Anthropogenic salinisation of inland waters. Hydrobiologia 466:329-337.
- Wright IA, Davies PJ, Findlay SJ, Jonasson OJ (2011) A new type of water pollution: concrete drainage infrastructure and geochemical contamination of urban waters. Marine and Freshwater Research 62(12):1355-1361.
- Wright PA, Iwama GK, Wood CM (1993) Ammonia and urea excretion in Lahontan cutthroat trout (Oncorhynchus clarki henshawi) adapted to the highly alkaline Pyramid Lake. Journal of Experimental Biology 175:153-172.
- Zalizniak L, Kefford BJ, Nugegoda D (2006) Is all salinity the same? The effect of ionic compositions on the salinity tolerance of five species of freshwater invertebrates. Marine and Freshwater Research 57:75-82.
Contacts: Authors & Contributors