pH
On this Page
pH is an expression of hydrogen ion concentration in water. Specifically, pH is the negative logarithm of hydrogen ion (H+) concentration (mol/L) in an aqueous solution:
pH = -log10(H+)
The term is used to indicate basicity or acidity of a solution on a scale of 0 to 14, with pH 7 being neutral. As the concentration of H+ ions in solution increases, acidity increases and pH gets lower, below 7 (see Figure 1). When pH is above 7, the solution is basic.
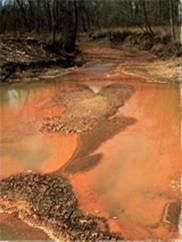 Figure 1. Example of an acidic stream due to mine drainage.
Courtesy of USGS Biology, Contaminant Biology ProgramBecause pH is a logarithmic function, one unit change in pH (e.g., 7 to 6) indicates a 10x change in H+ concentration in that solution. However, what is actually measured is hydrogen ion activity, not concentration.
Note that although basic solutions are alkaline, “basicity” and “alkalinity” are not exactly the same thing. Basicity refers to the ratio of hydrogen and hydroxyl (OH-) ions in solution, and is directly related to pH. Alkalinity is related to the acid-neutralizing capacity (ANC) of a solution. In aquatic ecosystems, processes that increase dissolved carbon dioxide or dissolved organic carbon (DOC) decrease pH but have no effect on ANC.
pH affects most chemical and biological processes in water. It is one of the most important environmental factors limiting species distributions in aquatic habitats. Different species flourish within different ranges of pH, with the optima for most aquatic organisms falling between pH 6.5-8. U.S. EPA water quality criteria for pH in freshwater suggest a range of 6.5 to 9.
Fluctuating pH or sustained pH outside this range physiologically stresses many species and can result in decreased reproduction, decreased growth, disease or death. This can ultimately lead to reduced biological diversity in streams.
Even small changes in pH can shift community composition in streams. This is because pH alters the chemical state of many pollutants (e.g., copper, ammonia), changing their solubility, transport and bioavailability. This can increase exposure to and toxicity of metals and nutrients to aquatic plants and animals.
Low pH
For a waterbody to be considered to have low pH, pH generally needs to be below 6 or 6.5, depending on the system. Low pH is addressed in this module as a proximate cause of effects on aquatic biota. It should be listed as a candidate cause when potential human sources and activities, site observations or observed biological effects support portions of the source-to-impairment pathways (see Figure 2).
This diagram and some of the other information also may be useful in Step 3: Evaluate Data from the Case.
Checklist of Sources, Site Evidence and Biological Effects
The checklist below will help you determine whether to include low pH among your candidate causes. The list is intended to guide you in collecting evidence to support, weaken or eliminate low pH as a candidate cause. For more information on specific entries, go to the When to List tab.
 Figure 2. A simple conceptual diagram illustrating causal pathways, from sources to impairments, related to low pH. Click on the diagram to view a larger version.Consider listing low pH as a candidate cause when the following sources and activities, site evidence and biological effects are present:
Sources and Activities
- Mine wastes
- Historic mine sites
- Acid-generating rocks/soils
- Power plants and other sources of acidic gases
- Coal pile runoff
- Industrial effluents
- Landfill leachate
- Confined animal feeding operations, dairy runoff
- Instream oxidation or reduction processes
- Recent draining of naturally inundated wetlands or floodplains
Site Evidence
- Low site pH data
- Acidic precipitation
- Geology or soil type (e.g., serpentine geology, soils)
- Mine drainage/overflows (current or historic)
- “Yellow-boy” (iron precipitates on rocks)
- Black or brown (tea colored) water
- Filamentous algae
Biological Effects
- Damage to gill epithelium
- Mucus on gills
- Decreased growth
- Reproductive failure
- Respiratory inhibition
- Ionoregulatory impacts
- Reduced number of species and individuals
- Mortality
- Replacement of acid-sensitive species with acid-tolerant species
- Metals: Common interactions to consider with low pH involve metals (e.g., aluminum, copper, zinc). Acid rain mobilizes and leaches metals (e.g., aluminum) into groundwater and streams, resulting in higher dissolved metal concentrations combined with low pH. Metals such as aluminum become increasingly bioavailable with decreasing pH (<6.0) due to increases in the free ionic form. This results in greater toxic effects at low pH than at neutral or high pH (Howells et al. 1983, Playle et al. 1989). The direct cause of biological effects may be pH (with metals contributing), metals (with pH contributing), or both pH and metals combined (i.e., neither acting alone would have caused observed effects).
- Ionic strength: To a large extent, pH controls both the chemical form and solubility of ionic chemicals.
- Unspecified toxic chemicals: The toxicity of compounds (e.g., phenols, cyanides) may increase with decreasing pH. For example, six phenols were more toxic to the guppy Poecilia reticulata at pH 5 or 6 than at pH 7 or 8 (Saarikoski 1981). Also, hydrogen cyanide (HCN) predominates at low and middle pH values and is about twice as toxic as CN-, which is found in appreciable amounts above pH 8.5 (Rand 1995).
- Ammonia: Concentration and toxicity of NH3 increases as pH increases, although less NH3 is required to produce toxic effects at lower pH (IPCS 1986, Wurts 2003).
High pH
A waterbody is considered to have a high pH if pH exceeds 9 for prolonged periods or with high frequency. High pH is less common than low pH as a candidate cause, because anthropogenic sources are acidic more often than basic.
High pH is addressed in this module as a proximate cause of effects on aquatic biota. It should be listed as a candidate cause when potential human sources and activities, site observations or observed biological effects support portions of the source-to-impairment pathways (Figure 3). This conceptual diagram and some of the other information also may be useful in Step 3: Evaluate Data from the Case.
Checklist of Sources, Site Evidence and Biological Effects
The checklist below will help you determine whether to include high pH among your candidate causes. The list is intended to guide you in collecting evidence to support, weaken or eliminate high pH as a candidate cause. For more information on specific entries, go to the When to List tab.
 Figure 3. A simple conceptual diagram illustrating causal pathways, from sources to impairments, related to high pH. Click on the diagram to view a larger version.Consider listing high pH as a candidate cause when the following sources and activities, site evidence, and biological effects are present:
Sources and Activities
- Industrial discharges
- Alkaline geology and soils
- Asphalt production or disposal
- Agricultural lime
- Oil and gas brines
- Industrial landfills
- Cement manufacturing
- Soap manufacturing
- Limestone gravel roads
Site Evidence
- Abundant macrophytes, filamentous algae or algal mats
- High site pH data
- Mineral deposits
- Low nighttime or early morning dissolved oxygen concentration
- (e.g., <40% saturation)
Biological Effects
- Decreased reproduction
- Reduced biodiversity
- Decreased growth
- Damage to skin, gills, olfactory organs, eyes
- Dissolved oxygen
- Ionic strength: To a large extent, pH controls both the chemical form and the solubility of ionic chemicals.
- Ammonia: Concentration and toxicity of NH3 increases as pH increases, although less NH3 is required to produce toxic effects at lower pH (IPCS 1986, Wurts 2003).
Low pH
On this Page
- Sources and Activities that Suggest Listing Low pH as a Candidate Cause
- Site Evidence that Suggests Listing Low pH as a Candidate Cause
- Biological Effects that Suggest Listing Low pH as a Candidate Cause
- Site Evidence that Supports Excluding Low pH as a Candidate Cause
Sources and Activities that Suggest Including Low pH as a Candidate Cause
Mine wastes/historic mine sites: Coal mining is a well known source of low pH, particularly where sulfur-bearing rock is present. Drainage from other mines and mine wastes can also be very acidic.
Acid generating rocks/soils: Interactions between rocks or soils and water (i.e., weathering) can generate acid. For example, andesite soils of the Great Basin region are derived from weathered volcanic rock and are strongly acidic.
 Figure 4. Gases emitted into the air contribute to acidic deposition.
Photo courtesy of The National Acid Precipitation Assessment Program (NAPAP)Sources of acidic gasses: Acidic deposition is the transfer of acidic compounds via rain, snow, and dry deposition. This process acidifies waters. Sulfur and nitrogen oxides are emitted into the atmosphere from power plants, industrial sources (e.g., pulp mills), and internal combustion engines (where they are transformed into H2SO4 and HNO3) (see Figure 4). When deposited into freshwater systems, these gasses increase SO42-, NO3-, and H+, which can decrease pH.
Streams and lakes with relatively low buffering capacity or low flow (e.g., intermittent and first order streams) are particularly susceptible to low pH from acidic deposition. Acidic deposition has occurred in the northeastern United States. Numerous cities and industrial plants in the Midwest and New England emit pollutants to air, which are then transported and deposited in the northeastern U.S. Acid deposition stored in snow and ice at high elevations or in cold climates can be a pulsed source of low pH water to streams during spring melting.
Point and nonpoint discharges: Industrial effluents (e.g., from metal plating and other processes requiring acid) can be discharged at a low pH if not properly treated. Nonpoint sources such as confined animal feeding operations (CAFOs), dairies and concentrated poultry farms can generate acidic runoff from manure if not controlled adequately. Coal pile runoff, runoff from urban areas, and leachate from improperly functioning septic systems and landfills can be acidic as well.
Instream oxidation or reduction processes: Inputs of ammonium can contribute to acidification, because the nitrification of NH4+ produces H+.
Recent draining of naturally inundated wetlands or floodplains: Under natural conditions, sulfur in permanently saturated soils is reduced. When those soils are drained and exposed to air, sulfuric acid can be generated and released to streams.
Site Evidence that Suggests Including Low pH as a Candidate Cause
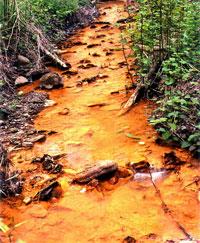 Figure 5. Example of acid mine drainage.
Photo courtesy of Peters Creek WatershedpH changes are generally not directly observable in the field, and observers usually must measure pH to detect a change. Thus, site observations indicative of low pH are typically indirect and largely restricted to observing one or more acid-producing sources (above).
Low pH may be indicated by the presence of metal precipitates on stream substrate. Common metal precipitates observed in streams under acidic conditions include iron, manganese, and aluminum which have a yellow (or orange or red), black, or white color, respectively (see Figure 5). Metal precipitates, notably iron, can result in a thick floc that smothers biota and degrades habitat quality to the point that many fauna are extirpated.
Black or brown (tea colored) water, common in southeastern U.S. swamps and bayous (e.g., Okefenokee Swamp, GA) are typically acidic due to humic and other natural organic acids derived from peat and dissolved vegetative material.
Some filamentous algae are tolerant of low pH and may dominate acidified lakes and streams without heavy precipitates (Niyogi et al. 1999). They include the filamentous green algae Klebsormidium, Microspora, Mougeotia, Ulotrix and Stigeoclonium (Stevens et al. 2001).
Biological Effects that Suggest Including Low pH as a Candidate Cause
Low pH has both lethal and sublethal effects on organisms. For many stream species, prolonged periods of pH <5 are likely to be lethal, resulting in significant changes in species composition and diversity. At pHs between about 5 and 6.5, sublethal effects on many stream species result in reduced fecundity, growth and population size. Acid water also damages the skin and gills of fish, amphibians and invertebrates. Skin damage increases fish susceptibility to fungal infections, which may lead to diseases such as epizootic ulcerative syndrome. Gill and skin damage and associated mucus production reduce the ability of fish to take in oxygen or regulate salt and water intake.
Meyer and Barclay's (1990) fish kill manual states that acids (as well as heavy metals and trinitrophenols) can cause “white film on gills, skin, and mouth.” Meyer and Barclay (1990) also state that hyperexcitability and attempts by fish to swim onto shore may be observed. These effects are symptomatic of low pH, but they are not specific enough to be considered diagnostic.
The presence of stream species that are either especially sensitive to or especially tolerant of low pH may suggest whether to include low pH as a candidate cause. The generalizations about acid tolerance and pH effects thresholds presented in this section are imprecise because responses are heavily dependent on co-occurring toxic and nutrient ions (Baker et al. 1990). However, they can be helpful. For example, if the impairment is characterized by the loss of brook trout, the cause is more likely to be a stressor to which that species is sensitive (e.g., high temperature, low DO) than low pH.
Certain aquatic or semiaquatic plants are indicative of low pH conditions. These include certain spike rushes, water lilies and many insectivorous marsh plants (e.g., venus fly traps, pitcher plants and sundews).
 Figure 6. This table illustrates pH values that can be tolerated by different species.Macroinvertebrate diversity, particularly for the commonly monitored EPT (Ephemeroptera, Plecoptera and Trichoptera) taxa, generally declines with declining pH. Of the EPT taxa, Ephemeroptera (mayflies) are generally most sensitive and Plecoptera (stoneflies) are generally most tolerant. Particularly sensitive species are found in the mayfly genera Heptagenia (Heptageniidae), Ephemerella (Ephemerellidae) and Paraleptophlebia (Leptophlebiidae) and the stonefly families Leuctridae and Perlidae.
These taxa are generally absent from streams with low pH. A few chironomids, including Apsectrotanypus trifascipennis and Rheocricotopus fuscipes, also are sensitive to acid and were only found in streams with pH >6 (Orendt, 1999). Invertebrates that require calcium carbonate for shell or cuticle development (e.g., clams, mussels, snails and amphipods) also are intolerant of low pH (<5) because acidic water dissolves calcium carbonate.
Other stream invertebrates are relatively tolerant of low pH (see Figure 6). These include Megaloptera (e.g., Corydalus) and craneflies (e.g., Tipula). Certain Chironomidae (midge) genera are also tolerant of low pH (e.g., some Orthocladiinae such as Corynoneura) and their dominance may indicate low pH (Orendt 1999). Also, northern pike (Esox lucius) can survive at pH 4-4.5 (Mackie 2001).
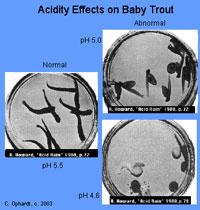 Figure 7. Examples of biological effects on reproduction.
Courtesy of C. OphardtLow pH can cause reproductive failure and local extinction of fish populations due to low egg fertilization rates and failure of normal egg development (see Figure 7). In general, minnows (small members of the family Cyprinidae) are the first to disappear from acidifying streams. Blacknose dace may disappear at pH below 6.1 and common shiners experience embryo mortality below pH 6.0 (U.S. EPA 2008). Eggs of several fish species (e.g., striped bass, lake trout, fathead minnow) will not develop properly at pH less than approximately 5.5 (Howells et al. 1983, Baker et al. 1990). For most North American species, juvenile and adult fish are generally more tolerant of moderately low pH (5-6.5) (Baker et al. 1990). Brook trout is a relatively acid-tolerant species, not disappearing until pH is near 5 (U.S. EPA 2008).
Low pH can have secondary effects on primary and secondary consumers due to pH stress on lower trophic levels. Low pH also can impede many ecosystem processes that depend on proper biological enzyme function (e.g., photosynthesis and decomposition). The sequence of direct and indirect effects of acidification is summarized in Table 1.
| pH Decrease | General Biological Effects |
|---|---|
| 6.5 to 6.0 | Small decreases in plankton and benthic invertebrate species richness resulting from loss of a few highly acid-sensitive species, but no measurable change in total community abundance or production. |
| Some adverse effects (decreased reproductive success) may occur for highly acid-sensitive fish species (e.g., fathead minnow, striped bass). | |
| 6.0 to 5.5 | Loss of sensitive species of minnows and dace (e.g., fathead minnow and blacknose dace); in some waters, decreased reproductive success of lake trout and walleye, which are important sport fish species in some areas. |
| Visual accumulation of filamentous green algae in near-shore zone of many lakes and in some streams. | |
| Distinct decrease in species richness and change in species composition of plankton and benthic invertebrate communities, although little if any change in total community abundance or production. | |
| Loss of some common invertebrate species from zooplankton and benthic communities, including many species of snails, clams, mayflies, amphipods, and some crayfish. | |
| 5.5 to 5.0 | Loss of several important sport fish species, including lake trout, walleye, rainbow trout and smallmouth bass, as well as additional nongame species such as creek chub. |
| Further increase in the extent and abundance of filamentous green algae in lake near-shore areas and streams. | |
| Continued shift in species composition and decline in species richness of plankton, periphyton and benthic invertebrate communities; decreases in total abundance and biomass of benthic invertebrates and zooplankton may occur in some waters. | |
| Loss of several additional invertebrate species common in surface waters, including all snails, most species of clams and many species of mayflies, stoneflies and other benthic invertebrates. | |
| Inhibition of nitrification. | |
| 5.0 to 4.5 | Loss of most fish species, including most important sport fish species (e.g., brook trout and Atlantic salmon). A few fish species are able to survive and reproduce in water below pH 4.5 (e.g., central mudminnow, yellow perch). |
| Measurable decline in whole-system rates of organic matter decomposition, potentially resulting in decreased rates of nutrient cycling. | |
| Substantial decrease in number plankton and benthic invertebrate species and further decline in plankton and periphyton species richness; measurable decrease in total community biomass of plankton and benthic invertebrates of most waters. | |
| Loss of additional plankton and benthic invertebrate species, including all clams and many insects and crustaceans. | |
| Reproductive failure of some acid-sensitive species of amphibians (e.g., spotted salamanders, Jefferson salamanders, leopard frogs). | |
| From Baker et al. (1990). | |
Site Evidence that Supports Excluding Low pH as a Candidate Cause
Low pH is buffered by minerals, such as calcium carbonate. If the stream is well buffered, or flows through soils and rocks high in alkaline minerals (e.g., limestone or dolomite), it is less likely that low pH is an appropriate candidate cause. The presence of acid-intolerant species such as ephemerellid mayflies, leuctrid or perlid stoneflies or an abundance of clams or snails would also be evidence supporting exclusion of low pH as a candidate cause.
However, criteria or other benchmarks alone should not be used to exclude low pH as a cause. Different species have different pH requirements, different sites have different naturally occurring levels of pH, and other agents may enhance the effects of pH.
High pH
On this Page
- Sources and Activities that Suggest Listing High pH as a Candidate Cause
- Site Evidence that Suggests Listing High pH as a Candidate Cause
- Biological Effects that Suggest Listing High pH as a Candidate Cause
- Site Evidence that Supports Excluding High pH as a Candidate Cause
Sources and Activities that Suggest Including High pH as a Candidate Cause
High pH can be caused by discharges from industries that use lime, lye or sodium hydroxide (NaOH); from agricultural runoff of fertilizers high in lime; or from industrial landfill leachates that contain solvents or lye. In particular, cement, asphalt and soap manufacturing may be sources of high pH due to the use of lime or lye. Runoff from limestone gravel roads also may increase pH.
In rare cases, high pH can be caused by natural conditions and mineralogy (e.g., weathering of chalk rock high in carbonates or olivine basalts). However, even in these cases, it is rare for stream pH to exceed 9.5. Leaching of naturally alkaline rocks and soils is exacerbated by physical disturbances such as tilling, mining and construction. An additional cause of elevated pH is high photosynthetic activity, which removes carbon dioxide from water and raises pH.
Site Evidence that Suggests Including High pH as a Candidate Cause
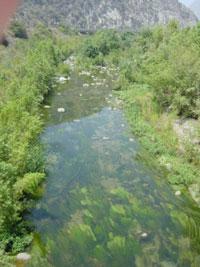 Figure 8. Stream with abundant aquatic plants and algae, which are sources of high pH. pH changes are not directly observable in typical field settings, and observers usually must measure pH to detect a change. However, high photosynthetic activity as evidenced by algal blooms or mats, or high macrophyte density, can cause pH to increase above tolerable levels (pH > 9), at least during daylight hours (Figure 8 and Figure 9). Certain species of Microcystis and Coccochloris algae grow optimally at pH 10 and do not grow below pH 8. Cladophora glomerata is only found in streams with pH greater than 8, whereas species such as Oedogonium kurtzi (green alga) and Phaeospaera perforate (yellow-green alga) are found in streams with pH less than 7 (Mackie 2001). High pH also may be indicated by certain mineral deposits in the stream, notably metal (e.g., nickel and cadmium) hydroxide precipitates that are insoluble above pH 9.
Biological Effects that Suggest Including High pH as a Candidate Cause
As with low pH, effects of high pH usually are not specific enough to be considered symptomatic. Short-term exposures of fish to high pH (~9.5) are rarely lethal to most fish species. However, prolonged exposure to pH between 9.5 and 10 can damage outer surfaces such as gills, eyes, and skin. Cypriniformes (e.g., minnows) often are less sensitive to high pH than Perciformes (e.g., perch). High pH also can affect the sensory epithelium of the fish olfactory system, making it difficult for fish to detect food, sex hormones or pheromones, alarm substances from conspecifics or toxic chemicals.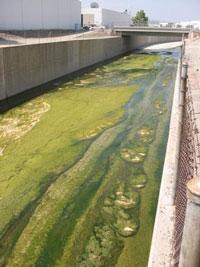 Figure 9. Excessive Cladophora algal growth in a canal.
In addition to direct effects of high pH, an important indirect effect to consider is its interaction with ammonia. As pH increases, unionized ammonia (NH3), which is more toxic to aquatic life than the ionized form (NH4+), becomes the dominant form. At pH > 9, the fraction of unionized ammonia is > 100 times the fraction at pH = 7 (> 90% of the total ammonia). This could result in ammonia toxicity if sufficient ammonia is present (e.g., >5 mg/L total ammonia at 25° C). Because ammonia toxicity can occur over relatively short exposure durations (hours to days depending on concentration), even short-term high pH events can contribute to biological effects. Therefore, when considering high pH as a candidate cause, bear in mind that it might be contributing to ammonia toxicity.
Site Evidence that Supports Excluding High pH as a Candidate Cause
There are no site observations that specifically provide evidence of the absence of high pH. We strongly caution against using benchmarks of effects (e.g., water quality criteria) as evidence for excluding high pH from your initial list of candidate causes. Different species have different pH requirements, different sites have different naturally occurring levels of pH, and other agents may enhance the effects of pH.
pH meter: A typical pH meter consists of a measuring probe connected to an electronic meter that measures and displays the pH reading. Because the meter measures hydrogen ion activity rather than concentration, it is affected by temperature and by other ions in solution. The influence of temperature on pH is usually automatically adjusted for by the meter.
Color comparator: Color comparators involve adding an indicator reagent to the sample that colors the sample water. Color intensity is proportional to pH of the sample. This color is then matched against a standard color chart to determine pH.
On this Page
- About Conceptual Diagrams
- Simple Conceptual Model Diagram (Low pH)
- Simple Conceptual Model Diagram (High pH)
- Detailed Conceptual Model Diagram (Low pH)
- Detailed Conceptual Model Diagram (High pH)
About Conceptual Diagrams
Simple Conceptual Model Diagram (Low pH)
pH is a measure of hydrogen ion concentration in an aqueous solution. pH decreases as hydrogen ion concentration increases, and these acidic conditions can adversely affect aquatic biota.
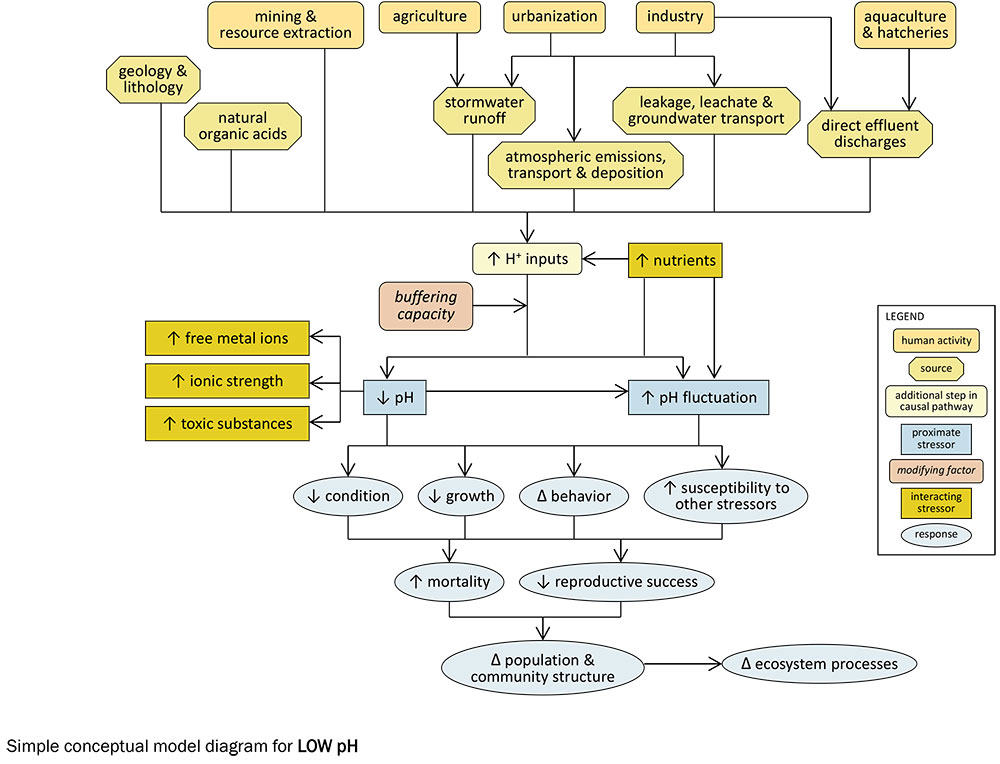
Certain human activities can result in increased hydrogen ion inputs into aquatic systems, including sources associated with agriculture (e.g., animal feedlots), urbanization (e.g., vehicles), industry (e.g., coal-fired power plants) and mining (e.g., acid mine drainage). Natural sources of hydrogen ions include acid-generating geologies and lithologies subjected to weathering and natural organic acids (e.g., humic acids).
Hydrogen ions from these sources can be introduced into aquatic systems via four main transport pathways (or transport-defined sources) (see Figure 10): stormwater runoff, leakage or leachate into groundwater sources and subsequent transport, atmospheric emissions and deposition and direct effluent discharges. Each pathway can contribute to increased hydrogen ion inputs into surface waters.
Whether hydrogen ion inputs to aquatic systems lead to decreases in pH depends upon buffering capacity, or the system's ability to neutralize those inputs. Nutrient concentrations also play a significant role in pH dynamics, because nitrification and respiration both produce hydrogen ions. Decreases in pH can in turn affect other stressors, such as by increasing free metal ions, increasing bioavailability and toxicity of toxic substances, and increasing ionic strength.
Decreases in pH and associated increases in pH fluctuation can contribute to decreased condition, decreased growth, altered behavior and increased susceptibility to other stressors in affected biota.
Ultimately, these effects may result in increased mortality, decreased reproductive success and changes in population and community structure and ecosystem function. For example, taxa sensitive to low pH (e.g., certain mayfly and stonefly taxa) may decrease, while more tolerant taxa such as tipulids (crane flies), megalopterans (alderflies, dobsonflies, fishflies and hellgrammites) and spike rushes may increase. Sensitive life stages (e.g., eggs in fish) also may decline.
Simple Conceptual Model Diagram (High pH)
Figure 3. A simple conceptual diagram illustrating causal pathways, from sources to impairments, related to high pH. Click on the diagram to view a larger version.High pH levels occur when hydroxide ion concentrations are high and hydrogen ions are scarce. Although acidic conditions more commonly result from human activities, alkaline conditions also can occur and adversely affect aquatic biota.
Certain human activities and associated sources can result in increased pH in aquatic systems (see Figure 11). These include stormwater runoff from sources associated with agriculture (e.g., lime-rich fertilizers) and urbanization (e.g., asphalt roads) and effluents and leachate from sources associated with industry (e.g., soap manufacturing plants) and mining (e.g., oil and gas brine mining wastes). Atmospheric emissions and deposition generally do not contribute to high pH conditions, a marked difference from low pH conditions.
There also are natural sources which can result in high pH conditions, such as naturally alkaline geologies and lithologies and high levels of photosynthesis. Because photosynthesis produces hydroxide ions, elevated nutrient concentrations may contribute to pH increases.
High pH levels can affect other stressors, most notably by increasing the proportion of ammonia in its unionized, toxic form. Increases in pH and pH fluctuation may contribute to decreased condition, decreased growth, altered behavior and increased susceptibility to other stressors in affected biota.
Ultimately, these effects may result in increased mortality, decreased reproductive success and changes in population and community structure and ecosystem function. For example, taxa sensitive to high pH (e.g., perciform fishes) may decrease, while more tolerant taxa (e.g., cypriniform fishes, Cladophora) may increase. These changes may result in reduced taxa richness or diversity.
Detailed Conceptual Model Diagram (Low pH)
pH is a measure of hydrogen ion concentration in an aqueous solution. pH decreases as hydrogen ion concentration increases, and these acidic conditions can adversely affect aquatic biota.
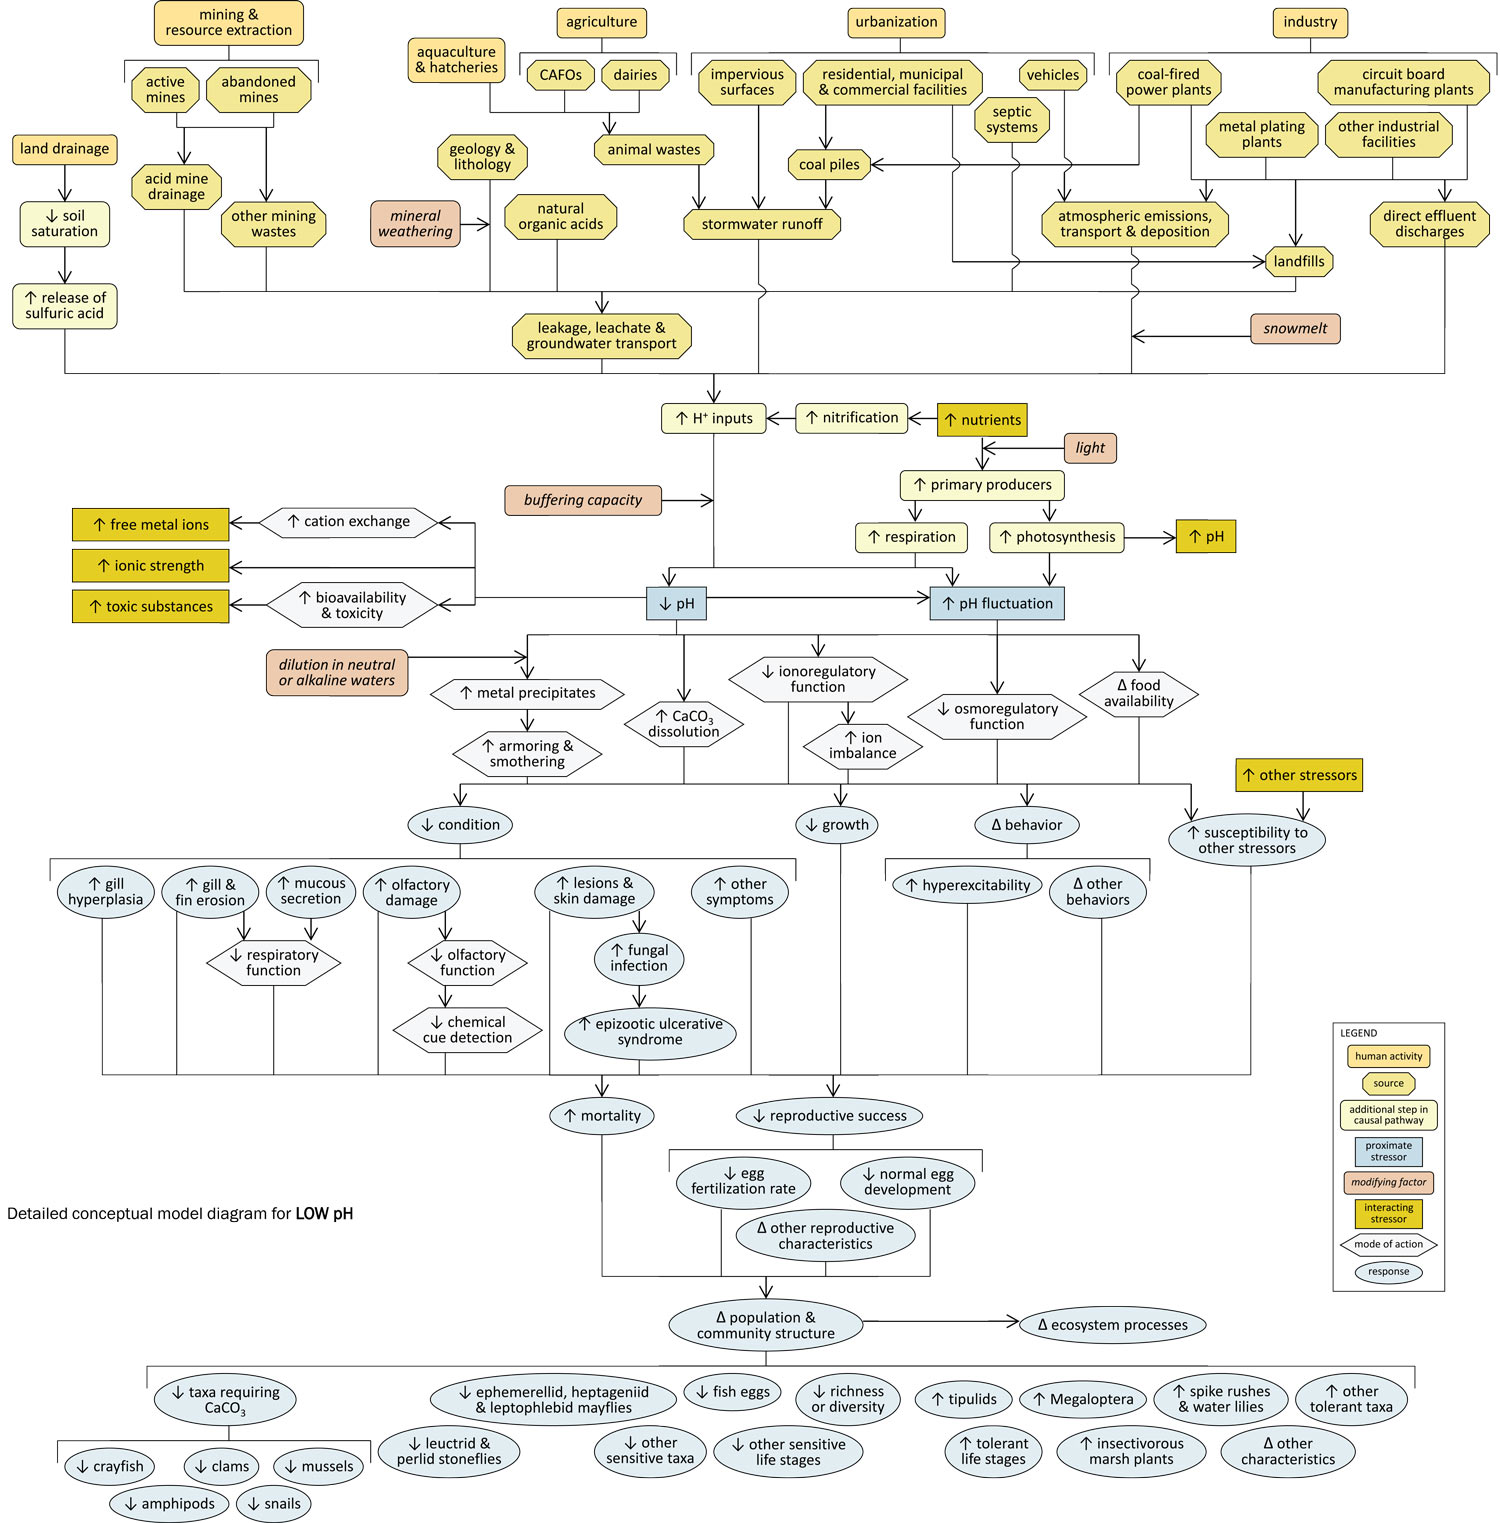
This conceptual diagram (see Figure 12) illustrates linkages between low pH and associated pH fluctuations (middle of diagram), the human activities and sources that can contribute to low pH (top of diagram) and the biological responses that can result (bottom of diagram). In some cases, additional steps leading from sources to stressors, modes of action leading from stressors to responses and other modifying factors also are shown. This narrative generally follows the diagram top to bottom, left to right.
Linking Sources to Stressors
Certain human activities and land uses can result in increased input of hydrogen ions into aquatic systems. Land drainage can reduce soil saturation and lead to sulfur oxidation and the release of sulfuric acid. Other sources of hydrogen ions include acid mine drainage and other mining wastes from active and historical mines; natural, acid-generating geologies and lithologies subjected to weathering; natural organic acids (e.g., humic acids); animal wastes from CAFOs, dairies and aquaculture facilities; coal piles and landfills associated with residential, municipal, commercial and industrial facilities; and emissions and effluents from coal-fired power plants, metal plating plants and other industrial facilities.
Hydrogen ions from these sources can be introduced into aquatic systems via four main transport pathways (or transport-defined sources): stormwater runoff, leakage or leachate into groundwater sources and subsequent transport, atmospheric emissions and deposition or direct effluent discharges. Each of these transport-defined sources can contribute to increased hydrogen ion inputs into surface waters. When atmospheric deposition of hydrogen ions occurs in the form of snowfall, snowmelt can result in pulsed delivery of hydrogen ions to surface waters.
Whether hydrogen ion inputs to aquatic systems lead to decreases in pH depends upon buffering capacity, or the ability of the system to neutralize those inputs. Streams with high bicarbonate concentrations are highly buffered, and may not become acidic even with significant hydrogen ion inputs. Once buffering capacity is exceeded, however, pH will decrease.
Instream oxidation-reduction processes also may influence pH. For example, nitrification and respiration both produce hydrogen ions, so nutrient concentrations may play a significant role in pH dynamics. Decreases in pH also can affect other stressors, such as by increasing free metal ions, increasing the bioavailability and toxicity of toxic substances, and increasing ionic strength (see the Metals, Ionic Strength, and Unspecified Toxic Substances modules for more information on these pathways).
Linking Stressors to Biological Responses
Decreases in pH and associated increases in pH fluctuation can adversely affect aquatic organisms via many potential modes of action. Low pH can lead to dissolution of calcium carbonate shells, ultimately leading to decreases in taxa with calcium carbonate shells (e.g., mussels and snails).
When low pH solutions (e.g., acid mine drainage) are neutralized upon entering higher pH streams, metals in those solutions can precipitate and smother or armor stream bottoms. Low pH also can compromise ionoregulatory and osmoregulatory function, or lead to changes in food availability.
These different modes of action all may contribute to decreased condition, decreased growth, altered behavior and increased susceptibility to other stressors in affected biota. Possible decreases in condition include gill hyperplasia, gill and fin erosion, lesions and skin damage (increasing susceptibility to fungal infections) and increased mucous secretion. Possible changes in behavior include hyperexcitability.
Ultimately, these effects may result in increased mortality and decreased reproductive success, particularly in terms of impaired egg fertilization and development. This can lead to changes in population and community structure and ecosystem function. Taxa sensitive to low pH (e.g., certain mayfly and stonefly taxa) may decrease, while more tolerant taxa (e.g., tipulids, megalopterans, spike rushes) may increase. Sensitive life stages (e.g., eggs in fish) also may decline. These changes in community structure may in turn affect ecosystem functions such as leaf decomposition.
Detailed Conceptual Model Diagram (High pH)
High pH levels occur when hydroxide ion concentrations are high and hydrogen ions are scarce. Although acidic conditions more commonly result from human activities, alkaline conditions also can occur and adversely affect aquatic biota.
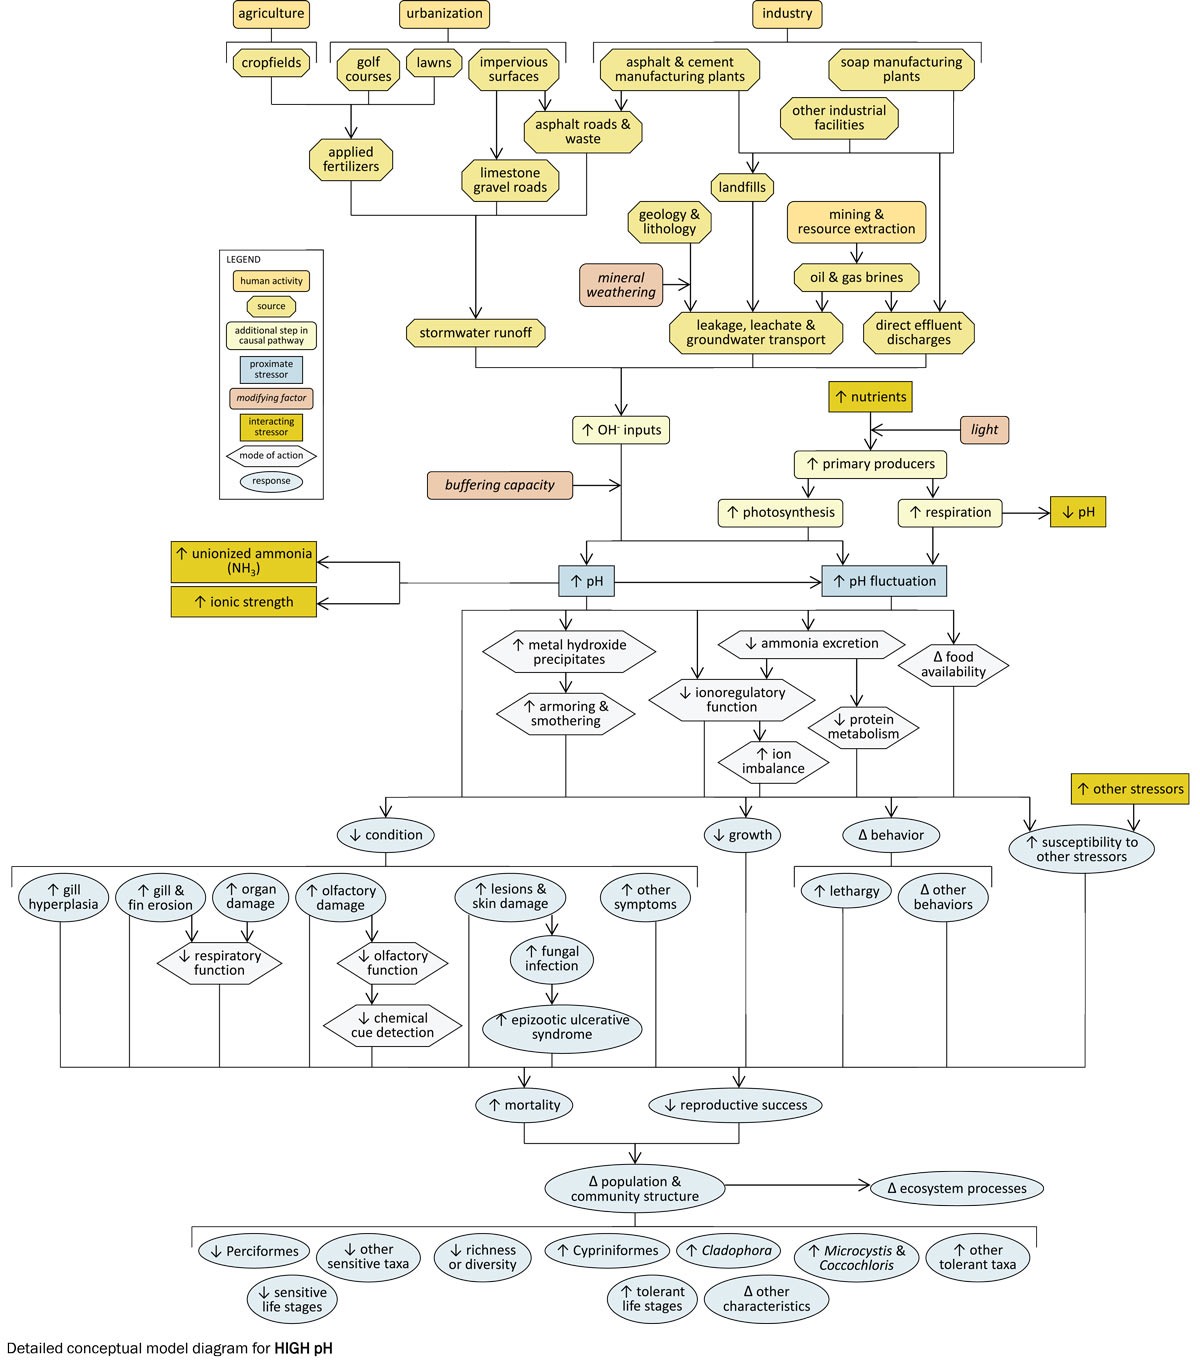
This conceptual diagram (see Figure 13) illustrates linkages between high pH and associated pH fluctuations (middle of diagram), the human activities and sources that can contribute to high pH (top of diagram) and the biological responses that can result (bottom of diagram). In some cases, additional steps leading from sources to stressors, modes of action leading from stressors to responses and other modifying factors also are shown. This narrative generally follows the diagram top to bottom, left to right.
Linking Sources to Stressors
Certain human activities and land uses can result in increased input of hydroxide ions into aquatic systems, leading to increases in pH. These sources include: runoff of lime-rich fertilizers applied to agricultural cropfields, golf courses and lawns; runoff from limestone gravel roads, asphalt roads and other asphalt waste; and effluents and leachate from oil and gas brine mining wastes or from industries that use lime, lye or sodium hydroxide (e.g., asphalt and cement manufacturing plants, soap manufacturing plants).
Atmospheric emissions and deposition are not significant transport sources for hydroxide ions and thus generally do not contribute to high pH conditions, a marked difference from low pH conditions. There also are natural sources which can result in high pH conditions, such as naturally alkaline geologies and lithologies and high levels of photosynthesis.
Because photosynthesis produces hydroxide ions, elevated nutrient concentrations may contribute to pH increases. High pH levels also can affect other stressors, most notably by increasing the proportion of ammonia in its unionized, toxic form (see the ammonia and ionic strength modules for more information on these pathways).
Linking Stressors to Biological Response
Increases in pH and associated increases in pH fluctuation can adversely affect aquatic organisms via many potential modes of action. For example, metal hydroxides can form and precipitate, smothering or armoring stream bottoms. Ammonia excretion may be impaired, adversely affecting ionoregulatory function and protein metabolism. Indirect effects such as changes in food availability also may occur.
These different modes of action all may contribute to decreased condition, decreased growth, altered behavior and increased susceptibility to other stressors in affected biota. Possible decreases in condition include gill hyperplasia, gill and fin erosion, lesions and skin damage (increasing susceptibility to fungal infections) and increased olfactory damage; possible changes in behavior include lethargy.
Ultimately, these effects may result in increased mortality, decreased reproductive success and changes in population and community structure and ecosystem function. Taxa sensitive to high pH (e.g., perciform fishes) may decrease, while more tolerant taxa (e.g., cypriniform fishes, Cladophora) may increase. These changes may result in reduced taxa richness or diversity.
This section presents an annotated bibliography of references providing information on stressor-response relationships for pH, as well as general background information. This is not meant to be a comprehensive bibliography of references dealing with pH. Rather, it is meant to highlight a few references that may be especially useful.
You may need a PDF reader to view some of the files on this page. See EPA’s About PDF page to learn more.
- Baker JP, Bernard DP, Christensen SW, Sale MJ (1990) Biological effects of changes in surface water acid-base chemistry. National Acid Precipitation Assessment Program, Washington DC. NAPAP Report 13.
This report describes the effects of acidification on biological communities. The described effects include, but are not limited to, changes in taxonomic composition, biomass and density. Mechanisms of effect are also described. The report includes methods for regional assessments of fish community effects and some regional analyses.
- Driscoll CT, Lawrence GB, Bulger AJ, Butler TJ, Cronan SC, Eagar C, Lambert KF, Likens GE, Stoddard JL, Weathers KC (2001) Acidic deposition in the northeastern United States: sources and inputs, ecosystem effects, and management strategies. BioScience 51(3):180-198.
This article provides an excellent general review of effects of acidic deposition on soil, forest vegetation, surface waters and terrestrial and aquatic ecosystems.
- Hamelink JL, Landrum PF, Bergman HL, Benson WH (Eds.) (1994) Bioavailability: Physical, Chemical, and Biological Interactions. Lewis Publishers, Boca Raton FL.
This book discusses factors affecting bioavailability of different pollutant classes (e.g., metals, nonpolar organics). The section Effects of Redox Processes on Acid-Producing Potential and Metal Mobility in Sediments has particularly relevant pH information. This book is more technical than the other reviewed literature. A good discussion of buffering factors includes a list the major processes that consume H+.
- Howells GG, Brown DJA, Sadler K (1983) Effects of acidity, calcium and aluminum on fish survival and productivity: a review. Journal of the Science of Food and Agriculture 34(6):559-570.
This article reviews studies of the effects of calcium and aluminum at low pH on survival. It also presents a section on modeling water quality effects on fish populations in an attempt to relate laboratory and field data.
- Mackie GL (2001) Applied Aquatic Ecosystem Concepts. Kendall/Hunt Publishing, Dubuque IA.
This textbook contains a section about acid precipitation that discusses the pH scale, geochemical influences, biological effects to several aquatic organisms, other atmospheric pollutants and mitigating lake acidification.
- Morris R, Taylor EW, Brown DJA, Brown JA (Eds.) (1989) Acid Toxicity and Aquatic Animals. Cambridge University Press, Cambridge UK.
This collection of papers describes a variety of biotic responses and modes of action in response to acid. The introduction The Causes and Consequences of Surface Water Acidification discusses acid precipitation and its effects at length. The rest of the book provides more specific and in-depth information regarding acid toxicity in aquatic systems.
- Orendt C (1999) Chironomids as bioindicators in acidified streams: a contribution to the acidity tolerance of chironomid species with a classification in sensitivity classes. International Review of Hydrobiology 84:439-449.
This study discusses the acid tolerance of chironomids based on their occurrence in a certain pH range.Twenty-five species are classified according to their acid sensitivity.
- Rand GM (Ed.) (1995) Fundamentals of Aquatic Toxicology: Effects, Environmental Fate, and Risk Assessment (2nd edition). Taylor and Francis, Washington DC.
Appendix C, Factors that Modify Toxicity, includes a section on hydrogen ion concentration. It contains information on how both low and high pH can modify pollutant toxicity.
- Robertson-Bryan, Inc. (2004) Technical Memorandum: pH Requirements of Freshwater Aquatic Life. California's Central Valley Water Quality Control Board.
This document is a review of many studies on pH requirements and effects on freshwater aquatic life. It reviews both fish and macroinvertebrates with respect to high and low pH.
- Scullion J, Edwards RW (1980) The effects of coal industry pollutants on the macroinvertebrate fauna of a small river in the South Wales coalfield. Freshwater Biology 10:141-162.
This paper is a case study that investigated the effects of coal industry pollutants on the macroinvertebrate fauna of a small river in a South Wales coalfield. It discusses the pH fluctuations due to drainage water from coal stockpiles and seasonal flows. The paper contains water quality data, arithmetic mean density of several species and a range of numbers of species and densities in relation to distance from the source. It contains a good discussion of low pH effects on specific species.
- U.S. EPA (2008) Integrated Science Assessment for Oxides of Nitrogen and Sulfur: Ecological Criteria. U.S. Environmental Protection Agency, Washington DC. EPA/600/R-08/082F.
This assessment reviews field and laboratory studies of the effects of acidification in aquatic and terrestrial ecosystems. Section B.6 contains 24 pages of tables summarizing effects by species and ecosystem.
You may need a PDF reader to view some of the files on this page. See EPA’s About PDF page to learn more.
- Baker JP, Bernard DP, Christensen SW, Sale MJ (1990) Biological effects of changes in surface water acid-base chemistry. National Acid Precipitation Assessment Program, Washington DC. NAPAP Report 13.
- Driscoll CT, Lawrence GB, Bulger AJ, Butler TJ, Cronan SC, Eagar C, Lambert KF, Likens GE, Stoddard JL, Weathers KC (2001) Acidic deposition in the northeastern United States: sources and inputs, ecosystem effects, and management strategies. BioScience 51(3):180-198.
- Dzombak DA, Ghosh RS, Young TC (2006) Physical-chemical properties and reactivity of cyanide in water and soil. Pp. 57-92 in: Dzombak DA, Ghosh RS, Wong-Chong GM (Eds). Cyanide in Water and Soil: Chemistry, Risk, and Management. CRC Press, Taylor & Francis Group, Boca Raton FL.
- Hamelink JL, Landrum PF, Bergman HL, Benson WH (Eds.) (1994) Bioavailability: Physical, Chemical, and Biological Interactions. Lewis Publishers, Boca Raton FL.
- Howells GG, Brown DJA, Sadler K (1983) Effects of acidity, calcium and aluminum on fish survival and productivity: a review. Journal of the Science of Food and Agriculture 34(6):559-570.
- IPCS (International Programme on Chemical Safety) (1986) Environmental Health Criteria 54: Ammonia. ExitUnited National Environment Programme, International Labour Organisation, World Health Organization.
- Mackie GL (2001) Applied Aquatic Ecosystem Concepts. Kendall/Hunt Publishing, Dubuque IA.
- Meyer FP, Barclay LA (1990) Field Manual for the Investigation of Fish Kills. U.S. Fish and Wildlife Service, Washington DC. Resource Publication 177.
- Morris R, Taylor EW, Brown DJA, Brown JA (Eds.) (1989) Acid Toxicity and Aquatic Animals. Cambridge University Press, Cambridge UK.
- Niyogi DK, McKnight DM, Lewis WM Jr (1999) Influences of water and substrate quality for periphyton in a montane stream affected by acid mine drainage. Limnology and Oceanography 44:804-809.
- Orendt C (1999) Chironomids as bioindicators in acidified streams: a contribution to the acidity tolerance of chironomid species with a classification in sensitivity classes. International Review of Hydrobiology 84:439-449.
- Playle RC, Goss GG, Wood CM (1989) Physiological disturbances in rainbow trout (Salmo gairdneri) during acid and aluminum exposures in soft water of two calcium concentrations. Canadian Journal of Zoology 67(2):314-324.
- Rand GM (Ed.) (1995) Fundamentals of Aquatic Toxicology: Effects, Environmental Fate, and Risk Assessment (2nd edition). Taylor and Francis, Washington DC.
- Robertson-Bryan, Inc. (2004) Technical Memorandum: pH Requirements of Freshwater Aquatic Life. California's Central Valley Water Quality Control Board.
- Saarikoski J, Viluksela M (1981) Influence of pH on the toxicity of substituted phenols to fish. Archives of Environmental Contamination and Toxicology 10:747-753.
- Scullion J, Edwards RW (1980) The effects of coal industry pollutants on the macroinvertebrate fauna of a small river in the South Wales coalfield. Freshwater Biology 10:141-162.
- Stevens AE, McCarthy BC, Vis ML (2001) Metal content of Klebsormidium-dominated (Chlorophyta) algal mats from acid mine drainage waters in southeastern Ohio. Journal of the Torrey Botanical Society 128:226-233.
- U.S. EPA (2008) Integrated Science Assessment for Oxides of Nitrogen and Sulfur: Ecological Criteria. U.S. Environmental Protection Agency, Washington DC. EPA/600/R-08/082F.
- Wurts W (2003) Daily pH cycle and ammonia toxicity. World Aquaculture 34(2):20-21.
Contacts: Authors & Contributors