Nutrients
On this Page
Nutrients are elements that are essential for plant growth. They include nitrogen (N), phosphorus (P), potassium (K), calcium (Ca), magnesium (Mg), sulfur (S) and silicon (Si). N, P and K are considered primary nutrients. N and P are the major limiting nutrients in most aquatic environments.
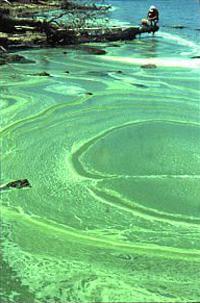 Figure 1. A cyanobacterium (Nodularia spumigens) bloom in the Gippsland Lakes, Victoria, Australia in January, 2002.
Courtesy of J.D. Kinnon, Wood's Hole Oceanographic InstituteWhen considering candidate causes, N and P are evaluated to determine the trophic status (or relative nutrient condition) of freshwater systems. In freshwater and estuarine systems, trophic status may be described as oligotrophic (low nutrients and productivity), mesotrophic (moderate nutrients and productivity) or eutrophic (high nutrients and productivity).
In most cases, nutrients are not proximate stressors for aquatic communities. Certain forms of N [ammonia (NH3), nitrite (NO2-) and nitrate (NO3-)] may be toxic. These effects are considered in the Ammonia and Unspecified Toxic Chemicals modules.
Nutrients have indirect adverse effects on aquatic communities through their effects on primary production and the growth and accumulation of plant/algal biomass. Nutrients also influence species composition of algae (i.e., phytoplankton in lakes, periphyton in streams) and other plant assemblages (Figures 1, 2; Dodds and Welch 2000).
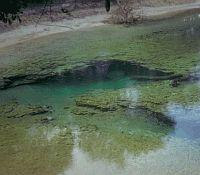 Figure 2. Large mats of submerged aquatic vegetation.
 Photo courtesy of C.A. Crandall, USGS
- Alteration of food resources: changes in the amount, type (e.g., living plant and algal biomass versus detritus) or palatability (e.g., algal cell size changes) of plant/algal food resources;
- Alteration of habitat structure: changes in benthic interstitial space, ease of movement across benthic surfaces or through the water column, availability of macrophytes as habitat for some species and life stages
- Production of algal toxins: substances toxic to fish, invertebrates and humans produced by some algae characteristic of eutrophic conditions
Algal growth and biomass accumulation associated with excess nutrients also hinder recreation, fishing, hunting and aesthetic enjoyment. Excess algal growth also may interfere with drinking water treatment and use of water by industrial facilities.
Checklist of Sources, Site Evidence and Biological Effects
This module addresses excess nutrients as a stressor leading to plant/algal assemblage changes and other proximate stressors (e.g., low dissolved oxygen). Toxic effects of nutrients are considered in the Ammonia and Unspecified Toxic Chemicals modules.
Nutrients should be listed as a candidate cause when potential human sources and activities, site observations or observed biological effects support portions of the source-to-impairment pathways (see Figure 3). This diagram and some of the other information also may be useful in Step 3: Evaluate Data from the Case.
The checklist below will help you identify key data and information useful for determining whether to include nutrients among your candidate causes. The list is intended to guide you in collecting evidence to support, weaken or eliminate excess nutrients as a candidate cause. For more information on specific entries, go to the When to List tab.
 Figure 3. A simple conceptual diagram illustrating causal pathways, from sources to impairments, related to nutrients. Click on the diagram to view a larger version.Consider listing nutrients as a candidate cause when the following sources and activities, site evidence and biological effects are present:
Sources and Activities
- Wastewater treatment plant effluents
- Industrial effluents
- Municipal landfills and waste disposal sites
- Animal feed lots or confined animal feeding operations
- Construction and development sites
- Combined stormwater and sanitary sewers
- Agricultural and irrigation runoff
- Runoff from impervious surfaces associated with urban or other developed areas
- Pasture and rangeland runoff
- Septic systems
- Atmospheric deposition
- Landscaping runoff (e.g., from residential lawns, golf courses and athletic fields)
Site Evidence
- Proliferation of filamentous algae or algal mats
- Phytoplankton blooms (i.e., green water)
- Abundant macrophytes
Biological Effects
- Alteration of algal assemblages (i.e., phytoplankton or periphyton)
- Alteration of invertebrate assemblages (i.e., zooplankton or benthic macroinvertebrates)
- Fish kills
- Dissolved oxygen
- Temperature
- Suspended and bedded sediments
- pH
- Ammonia toxicity
- Pathogens
- Co-migrating contaminants
On this Page
- Sources and Activities that Suggest Listing Nutrients as a Candidate Cause
- Site Evidence that Suggests Listing Nutrients as a Candidate Cause
- Biological Effects that Suggest Listing Nutrients as a Candidate Cause
- Site Evidence that Supports Excluding Nutrients as a Candidate Cause
Sources and Activities that Suggest Listing a Nutrient-Related Candidate Cause
Nutrient discharges from point sources enter waterbodies from discrete locations (e.g., pipes and canals). These discharges also may be continuous, making them easier to identify and monitor. Point sources may be municipal or industrial effluents, confined animal feeding operation discharges, collected runoff from construction and development sites, or collected leachates from municipal landfills or waste disposal sites. In general, point sources that are not stormwater-related are relatively constant with respect to loadings (National Research Council 2000).
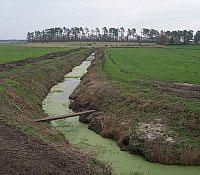 Figure 4. An agricultural ditch, which can convey nutrients from an agricultural field to a receiving stream.
Photo courtesy of USGSNutrients in runoff and groundwater enter waterbodies from their terrestrial watersheds. They may enter diffusely from overland flow or groundwater discharge or at discrete locations (e.g., agricultural drainage tiles, stormwater outfalls). Accounting for and controlling these inputs is more difficult because they typically result from diffuse human activities across larger land areas.
In addition, groundwater flow is typically unobserved and contributing source areas may be far from actual receiving waters. Agriculture (Figures 4, 5, 6)and urbanization in the upstream watershed are common alterations that are sources of nutrients. Silviculture, grazing, lawns and golf courses, may also produce runoff containing elevated nutrients.
Both climate and physical watershed characteristics can increase the potential for nutrients to enter waterbodies via nonpoint source pathways. Land alterations generally increase nutrient delivery to streams. These alterations often enhance water flow across the landscape and mobilize nutrients that would otherwise be sequestered, thus increasing inputs to receiving waters. In addition, activities that disturb soils and increase erosion also increase nutrient input to surface waters.
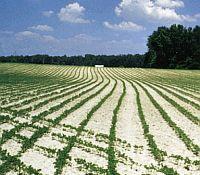 Figure 5. Agricultural fields can be nonpoint sources of nutrients to streams.
Photo courtesy of D.F. Usher, USGSThe effect of these alterations is enhanced if soil nutrient concentrations are increased by fertilizer use, leaking septic systems and land application of manure or sludge. High rainfall, steep slopes and clay soils promote nitrogen and phosphorus transport via soil erosion and runoff. Low soil organic matter content and underlying sand, gravel, karst or bedrock promote nitrogen transport to streams and rivers via groundwater (USGS 1999). More direct nutrient inputs may be evidenced by steeply sloping banks or unfenced pastures.
Atmospheric deposition, either directly on waterbodies or on watersheds, can be an important source of nitrogen. The primary source of this deposited gaseous nitrogen is combustion of fossil fuels in power plants and motor vehicles. Deposition of nutrients in dust can be an important source in some regions and ecosystem types (e.g., Caribbean coral reefs).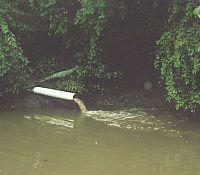 Figure 6. The outlet pipe for a tile drainage system, which can convey water and nutrients from agricultural fields directly to streams, bypassing any riparian zone.
Site Evidence that Suggests Listing a Nutrient-Related Candidate Cause
Observations of aquatic plants may suggest the presence of excess nutrients. These observations could include prolific rooted emergent or floating macrophytes or algae in the water column (phytoplankton) or attached to submerged surfaces (periphyton). Algae may be dominated by filamentous forms or may form algal mats (see Figure 7) or blooms.
Biological Effects that Suggest Listing a Nutrient-Related Candidate Cause
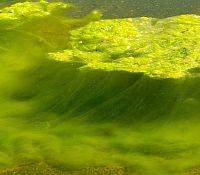 Figure 7. Nutrient inputs can encourage the growth of thick mats of filamentous green algae, especially when flow rates are low.If the biological impairment is defined by changes in the aquatic plant community, nutrients should be considered as a candidate cause. Biological parameters indicative of elevated nutrient concentrations include increased chlorophyll a concentrations, altered structure of periphyton or algal assemblages and decreased abundance of submerged rooted macrophytes.
For animal assemblages, nutrients are generally not the proximate stressor. However, nutrients often alter these assemblages via their effects on food or habitat. Increased phytoplankton may increase the filter feeder abundance, whereas increased periphyton may increase scraper abundance. Increased macrophytes may favor fish that are ambush predators over those that are pursuit predators. Heavy growth of periphyton may decrease the habitat quality of gravel substrates for many species.
Algal blooms may include species that produce algal toxins. Fish kills or kills of macroinvertebrates suggest that algal toxins may be the cause of impairment.
Because nutrient enrichment often leads to decreased dissolved oxygen concentrations, fish kills and other biological effects suggesting low dissolved oxygen also may suggest high nutrient concentrations.
Specific biological measures that may be related to nutrients are discussed in the following subsections.
Chlorophyll a: Chlorophyll a (Chl a) is a plant pigment produced by algae. Chl a is a common measure of algal biomass, and increases often indicate excess nutrients. There are several recognized methods for measuring Chl a, including spectrophotometric or fluorometric techniques. Sampling, filtration and preservation techniques are important in the accuracy of these analyses (Carlson and Simpson 1996).
Plant/algal community structure: Periphyton includes all organisms (algae, bacteria, protozoans and fungi) attached to submerged substrates. Periphytic algal communities have been used as water quality indicators in freshwater ecosystems and indices are being developed for estuarine habitats.
Periphyton can be collected by colonization of artificial substrates, such as periphytometers, or by direct sampling of natural substrates. Methods for characterizing periphytic assemblages use characterizations of taxonomic structure or standing crop (e.g., species identification and counts); relative abundance and dominance; community diversity, evenness, and similarity; biomass (e.g., ash-free dry mass, adenosine triphosphate content); pigment content (usually Chl a); and biovolume (ASTM 1999, APHA et al. 1998; Table 1).
| Periphyton Metric | Expected Response to Increased Nutrients | Description |
|---|---|---|
| Ash-free dry mass (mg/m²) | Increase | Ash-free dry mass of periphyton per unit area is a measure of the periphyton's organic component. |
| Achnanthes minutissima (RA*) | Decrease | This cosmopolitan diatom species is relatively intolerant of eutrophic conditions. |
| Eutrophic diatoms (RA* or richness) | Increase | These diatom taxa are identified as tolerant of eutrophic conditions [see van Dam et al. (1994) for classifications]. |
| Ratio, ACC to CMN diatoms | Decrease | The diatom genera Achnanthes, Cocconeis and Cymbella are relatively intolerant of eutrophic conditions, whereas the genera Cyclotella, Melosira and Nitzschia are relatively tolerant of eutrophic conditions. |
| Nitrogen-heterotrophic diatoms (RA*) | Increase | These diatom taxa can use or require organic nitrogen for their metabolism [see van Dam et al. (1994) for classifications]. |
| Diatom tolerance value | Increase | If diatoms are scored using a descending scale, with hypereutrophic species (van Dam et al. 1994) scoring high (i.e., 3) and oligotrophic species scoring low (i.e., 1), the tolerance value is the average score for all diatoms identified in a sample. |
| Dominant diatom species (RA) | Increase | Under eutrophicconditions, one or a few diatom species often dominate the assemblage. |
| *RA = relative abundance | ||
Functional characteristics include measurements of photosynthesis (i.e., oxygen production, carbon assimilation), respiration (i.e., oxygen consumption) or enzymatic activity (e.g., alkaline phosphatase activity). The calculation and application of diversity and similarity indices to biological data, as well as other statistical techniques (e.g., principal components analysis or multi-dimensional scaling) have been summarized by Clarke and Warwick (1994), Legendre and Legendre (1998) and McCune et al. (2002). A review by Wetzel (1979) summarized problems associated with the collection and identification of periphyton that need to be considered during data interpretation. These problems include substrate selectivity; poor differentiation between alive and dead individuals, particularly for diatoms; and sample replication and reproducibility.
In streams and rivers, periphytic algae live attached to submerged and benthic substrates. In extreme cases, a periphyton mat may cover all benthic surfaces of a stream. In lakes, deleterious “algal blooms” may form at different times of year. These blooms represent a significant alteration of the phytoplankton community structure, with one or a few species reproducing rapidly to become numerous and dominant (millions of cells per ml). In some cases, the dominating alga can produce toxins capable of killing fish or animals (e.g., cattle, hogs) that drink the water. Examples of freshwater algae known to produce toxins include Anabaena and Cylindrospermopsis species. Some freshwater dinoflagellates also produce toxins. Blooms of toxin-producing algae are referred to as hazardous algal blooms (HABs).
In addition to increased algal or macrophyte standing crops, nutrient enrichment often changes the taxonomic structure of plant assemblages. If only phosphorus increases, nitrogen-fixing cyanobacteria (Cyanophyta or blue-green algae) may dominate phytoplankton assemblages in lakes. In streams, chlorophytes (Chlorophyta or green algae) and cyanobacteria may dominate over diatoms. These taxonomic changes also may result in altered cell size or palatability, which can affect planktonic-feeding zooplankton in lakes or algal-feeding grazers in streams. In addition, phytoplankton increases can raise turbidity and reduce light penetration, potentially leading to decreases in benthic flora (e.g., submerged aquatic vegetation).
Macroinvertebrates and fish: Benthic macroinvertebrate communities consist of bottom-dwelling aquatic insects and other invertebrates that occur in streams, rivers or lakes. These communities can be useful indicators of anthropogenic stress. Macroinvertebrate taxa composition and density are a function of water quality during the recent past. This ncludes random pollutant discharges that may not be detected by water quality monitoring. Macroinvertebrates survive and thrive under a range of environmental conditions, are easily collected, and are associated with well-documented and readily available assessment methodologies. Some community metrics may suggest the type of stressor(s) impacting an aquatic system, or serve as more general indicators of stress (Table 2).
| Macroinvertebrate Metric | Expected Response to Increased Nutrients | Description |
|---|---|---|
| EPT taxa (RA or richness) | Decrease | Ephemeroptera (mayfly), Plecoptera (stonefly) and Trichoptera (caddisfly) larvae often decrease with increases in many stressors, including nutrient enrichment (Klemm et al. 2003). |
| Mollusca and Crustacea (RA or richness) | Increase | Mollusks (e.g., gastropod snails, fingernail clams) and crustaceans (e.g., amphipods, isopods) are tolerant of nutrient enrichment (Griffith et al. 2005). |
| Most dominant taxa (RA) | Increase | Reduced diversity and uneven distribution of individuals among taxa is characteristic of increased stress, including nutrient enrichment (Barbour et al. 1996). |
| Tanytarsini (RA or richness) | Decrease | This tribe of Chironomidae is generally considered intermediate in tolerance to stressors such as nutrients (Deshon 1995). |
| Grazers and scrapers (RA or richness) | Increase | Grazers and scrapers feed on the increased algal production associated with nutrient enrichment (Barbour et al. 1999). |
| Sensitive species (RA or richness) | Decrease | Sensitive species decrease in response to increased stress, including nutrient enrichment (Miltner and Rankin 1998). |
| Tolerant species (RA) | Increase | More tolerant species may increase in abundance as result of nutrient enrichment (Miltner and Rankin 1998). |
An increase in algal growth resulting from increased nutrients can affect aquatic food webs, including the macrobenthic component. For example, increased periphyton productivity in small streams may shift the macrobenthic community to one dominated by species that use algal mats for food and habitat (e.g., gastropod snails and other grazers and scrapers). Increased algal growth also means increased algal decomposition and increased production of fine organic particles. This, in turn, may greatly increase the densities of filter-feeders (e.g., blackfly larvae).
Excess macrophytes or algae can alter habitats for both fish and macroinvertebrates by taking up space and altering substrate surfaces. Excess algae can contribute to turbidity, which interferes with sight-feeding fish (see Sediments module).
Site Evidence that Supports Excluding Nutrients as a Candidate Cause
There are no site observations that specifically provide evidence of the absence of nutrients. General reasons for excluding a candidate from the list are described in Step 2 of the Step-by-Step guide and in Tips for Listing Candidate Causes.
We strongly caution against using benchmarks of effects (e.g., water quality criteria) as evidence for excluding nutrients from your initial candidate cause list. Different species have different nutrient requirements, and different sites have different naturally occurring levels of nutrients.
Nitrogen
Common forms of nitrogen in aquatic ecosystems include gaseous nitrogen (N2); ammonia (NH3) from nitrogen fixation, fertilizers, animal wastes and organic matter decomposition; nitrite (NO2-) and nitrate (NO3-) from nitrification or fertilizers; and organic nitrogen compounds [see Wetzel (2001), Chapter 12 for discussion of the nitrogen cycle]. The most important form in terms of nutrient impairment is nitrate, due to its abundance and mobility in the surface and subsurface environment. As with many environmental pollutants, various methods are used to analyze nutrients and these methods are not always interchangeable (Table 3).
| Nitrogen Form | Units | Common Names | Measures |
|---|---|---|---|
| Ammonia | μg/L (as N) | Ammonia nitrogen, NH4-N, NH3 | Dissolved ammonium + unionized ammonia are measured via phenate colorimetric method [Standard Methods 4500-NH3 F, G (APHA et al. 1998)]. |
| Nitrite | μg/L (as N) | Nitrite nitrogen, NO2-N | Dissolved nitrite is measured via a colorimetric method [Standard Methods 4500-NO2- B (APHA et al. 1998)]. |
| Nitrate | mg/L (as N) | Nitrate nitrogen, NO3-N | Dissolved nitrate is reduced to nitrite in the presence of cadmium, followed by colorimetric method [Standard Methods 4500-NO3- E, F (APHA et al. 1998)]. Nitrate and nitrite may also be analyzed via ion chromatography [Standard Methods 4110 B (APHA et al. 1998)]. |
| Dissolved inorganic nitrogen | mg/L (as N) | DIN | Nitrate, nitrite and ammonia are commonly reported together as DIN. |
| Dissolved organic nitrogen | mg/L (as N) | DON, dissolved Kjeldahl nitrogen, dissolved ammonia + organic nitrogen | Measure ammonium, then convert organic nitrogen to ammonium by digestion and re-measure for total ammonium using a colorimetric method [Standard Methods 4500-Norg B, C (APHA et al. 1998). |
| Total nitrogen | mg/L (as N) | TN | Method needs to specify whether it is done via persulfate digestion, which converts all forms of N to nitrate, followed by measurement of nitrate by a colorimetric method [such as in Standard Methods 4500-N C (APHA et al. 1998)] or via analysis of total Kjeldahl nitrogen [TKN, such as in Standard Methods 4500-Norg B, C (APHA et al. 1998)]. |
Phosphorus
Phosphorus is present as dissolved orthophosphate (PO43-), various organic phosphorus compounds and sediment-associated (particulate) phosphorus [see Wetzel (2001), Chapter 13 for discussion of the phosphorus cycle]. Approximately 25% of the total phosphorus in aquatic systems is considered biologically available. Dissolved orthophosphate is the most biologically available form of phosphorus, but it is generally less than 10% of total P in aquatic ecosystems. Because the organic and inorganic forms of phosphorus vary significantly in their reactivity and availability for biological productivity, determining phosphorus levels can be complicated. The most commonly used measurement for phosphorus is total phosphorus (Table 4).
| Phosphorus Form | Units | Common Names | Measures |
|---|---|---|---|
| Orthophosphate | μg/L (as P) | PO4-P, SRP or soluble reactive phosphorus | Dissolved inorganic phosphorus and labile organic phosphorus are measured via a colorimetric method [Standard Methods 4500-P C or E, F (APHA et al. 1998)]. |
| Total dissolved phosphorus | mg/L (as P) | TDP | Dissolved phosphorus compounds are converted to orthophosphate via digestion, followed by measurement via a colorimetric method; dissolved organic phosphorus (DOP) can be calculated by subtracting PO4-P. |
| Total phosphorus | mg/L (as P) | TP | Phosphorus compounds are converted to orthophosphate via digestion, followed by colorimetric method. Digestion methods for TDP and TP are outlined in Standard Methods 4500-P B (APHA et al. 1998); persulfate typically is used for the digestion. |
On this Page
- About Conceptual Diagrams
- Simple Conceptual Model Diagram: (N and P)
- Detailed Conceptual Model Diagram: (N and P)
About Conceptual Diagrams
Conceptual diagrams are used to describe hypothesized relationships among sources, stressors and biotic responses within aquatic systems.
Simple Conceptual Model Diagram (Nitrogen and Phosphorus)
Enrichment of aquatic systems due to excess nutrient concentrations is a common cause of biological impairment. Although aquatic plants and microbes require nitrogen (N) and phosphorus (P) for growth and reproduction, excess nutrient inputs may adversely affect biotic communities.Figure 3. A simple conceptual diagram illustrating causal pathways, from sources to impairments, related to nutrients. Click on the diagram to view a larger version.
Often excess inputs of N and P are related to human activities and sources in the watershed, which influence in-stream nutrient concentrations via six dominant pathways (see Figure 8): (1) by increasing delivery of N or P from the watershed; (2) by increasing amount of N or P in soils transported into streams; (3) by increasing amount of N or P in surface runoff; (4) by increasing amount of N or P in subsurface waters; (5) by increasing amount of N or P in wet or dry deposition; and (6) by increasing amount of N or P in discharged waters.
For example, many human activities (e.g., agricultural practices, residential and commercial development) lead to land cover alteration, with subsequent increases in surface runoff and watershed erosion. This land cover alteration can increase the mobilization of N and P bound to watershed soils, ultimately increasing nutrient delivery to streams.
Other sources (e.g., fertilizers and animal wastes associated with agricultural and residential practices, geology of the landscape) may directly elevate N and P concentrations within the watershed. Increases in watershed N or P loading associated with these sources can eventually reach streams via surface runoff, via subsurface waters (e.g., groundwater inputs), or attached to washed-in particles.
Once in the stream, N or P may occur in dissolved organic, dissolved inorganic or particulate forms, with transformations occurring among these forms depending on environmental conditions (e.g., dissolved oxygen concentrations). Although N and P may be considered candidate causes, excess nutrients are not proximate stressors. Fish and invertebrates are usually not directly adversely affected by excess nutrient concentrations, but rather are affected by other proximate stressors resulting from nutrient enrichment.
Nutrients can be associated with biological impairment by several pathways. Dissolved N and P can be taken up by primary producers (algae and macrophytes) and microbes, although whether primary producers respond to increased nutrient concentrations depends on adequate light levels.
Increases in plant and microbial biomass or productivity may negatively impact aquatic fauna in multiple ways. For example, increases in microbial assemblages may lead to greater microbial infection of invertebrates or fish, or altered benthic organic matter processing (e.g., faster processing rates).
Increased microbial and plant respiration often leads to decreases in dissolved oxygen concentrations, especially during times when photosynthesis is limited. In addition, increased photosynthesis may lead to increased pH. This increase may be especially important when N is elevated, as unionized ammonia, a toxic form of N, increases at high pH. Blooms of certain algal taxa also may result in increased production and release of toxins that can affect fish or invertebrates.
Increased plant or algal production may translate to increased food resources, which can benefit herbivorous organisms but may adversely impact other taxa by altering the food resources derived from detritus. Changes in plant assemblage structure also may occur with enrichment, and these changes can affect aquatic fauna by altering habitat structure or by altering the quantity or quality of food resources.
Changes in community structure may occur even without overall increases in primary producers, due to alterations of nutrient availability ratios. Increases in suspended organic matter (i.e., phytoplankton or suspended benthic algae) also can negatively affect aquatic biota, for example by increasing turbidity.
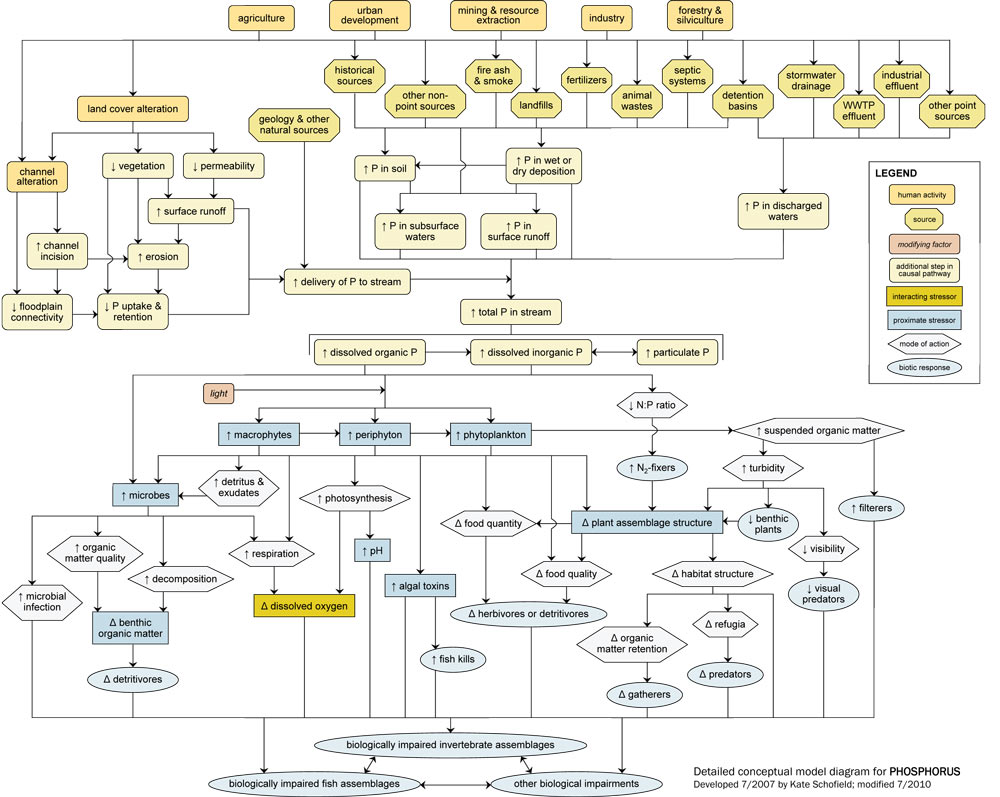
Detailed Conceptual Model Diagrams (Nitrogen and Phosphorus)
Algae and aquatic plants require nitrogen (N) and phosphorus (P) for photosynthesis. The availability of these nutrients often drives ecosystem productivity and determines trophic status. However, excessive amounts of P and N can have several negative effects on aquatic communities.
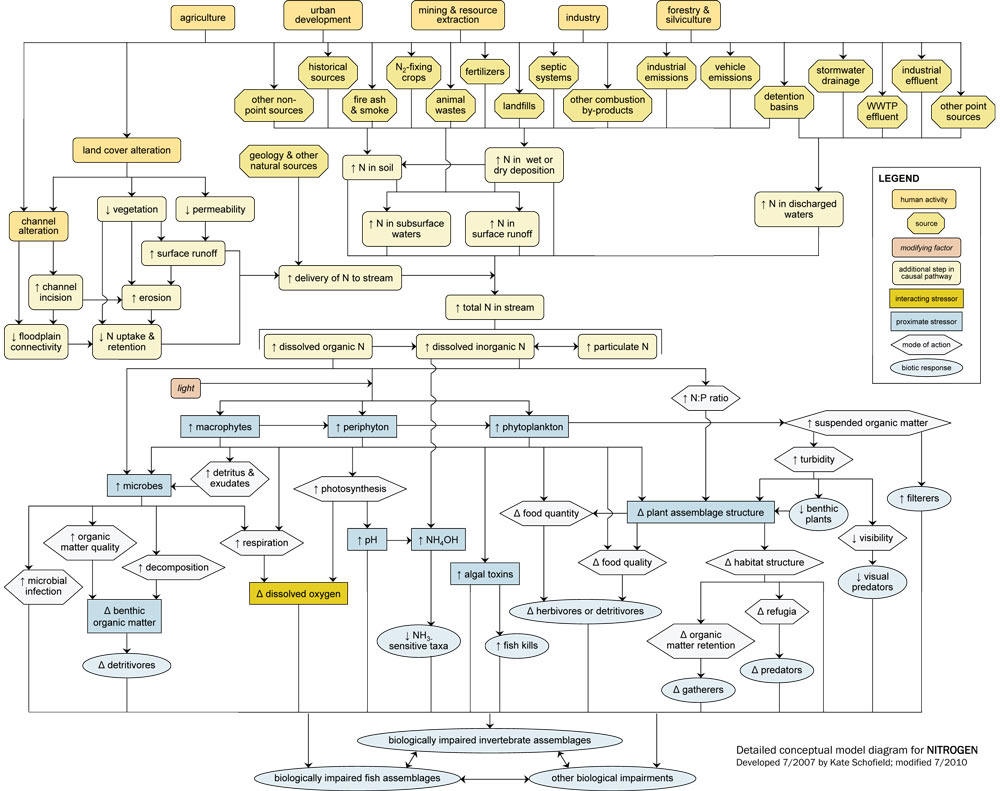
The N and P conceptual diagrams depict relationships between human activities and processes that increase nutrient levels in surface waters, and the effect of nutrient enrichment on aquatic communities. Note that nutrient enrichment itself is not shown as a proximate stressor, but affects processes and states that lead to proximate stressors (e.g., changes in dissolved oxygen or food resources) that have direct impacts on aquatic invertebrates and fish.
The nitrogen conceptual diagram depicts sources that introduce nitrogen to streams, and land use and channel alterations that alter the delivery of nutrients to streams, near the top of the figure, leading down the diagrams to steps in the causal pathway, proximate stressors, modes of action and eventually biological responses at the bottom. This narrative generally follows the diagram from top to bottom, left to right.
Linking Sources to Proximate Stressors
Nutrients naturally occur in soils and vegetation and move throughout watersheds in regular cycles, but excess nutrient loadings to streams can adversely impact aquatic biota.
Often excess inputs of N and P are related to human activities and sources in the watershed, which influence in-stream nutrient concentrations via six dominant pathways: (1) by increasing delivery of N or P from the watershed; (2) by increasing amount of N or P in soils transported into streams; (3) by increasing amount of N or P in surface runoff; (4) by increasing amount of N or P in subsurface waters; (5) by increasing amount of N or P in wet or dry deposition; and (6) by increasing amount of N or P in discharged waters.
For example, many human activities (e.g., agricultural practices, residential and commercial development) lead to land cover alteration, with subsequent increases in surface runoff and watershed erosion. This land cover alteration can increase the mobilization of N and P bound to watershed soils, ultimately increasing nutrient delivery to streams. Decreases in vegetation and floodplain connectivity also may reduce N and P uptake and retention on the floodplain, further increasing delivery to streams.
Other sources directly elevate N and P concentrations within the watershed. One of the most significant ways that humans increase nutrients in streams is through fertilizer use for agricultural, residential, and commercial purposes, thus increasing total nutrient levels in the watershed (top center). Waste inputs also are common sources of added nutrients, from both point source discharges (e.g., WWTP effluents discharged directly into streams) and non-point sources (e.g., leakage from septic tanks).
In general, potential sources of N and P are similar, although the relative importance of those sources may differ. For example, P binds much more easily to soil than N, so pathways involving soil adsorption (e.g., erosion pathways) are usually much more significant for P than for N dynamics.
However, some sources only add significant amounts of N to systems, and thus are shown only in the N diagram. These include vehicle emissions and other combustion by-products, which emit N to the atmosphere and eventually deposit N into streams through air transport mechanisms. Nitrogen-fixing crops (e.g., legumes such as soybeans) also can increase N levels in soil by transforming atmospheric nitrogen gas into a biologically available form.
In streams, N and P are present in three main forms, based on size and chemical composition: dissolved organic N and P, dissolved inorganic N and P, and particulate N and P (center curved rectangles). These forms are dynamic, and many transformations and reactions occur which convert particulate to dissolved forms (and vice versa), and organic to inorganic forms. Only dissolved organic and inorganic forms can be taken up by microbes and primary producers directly.
Linking Proximate Stressors to Biological Impairment
Microbes (lower left) (e.g., bacteria, fungi) require nutrients for growth. They can obtain these nutrients directly from dissolved organic and inorganic forms and indirectly from plant-based detritus and exudates. Increased nutrients can stimulate increases in microbial biomass and production, which can directly affect biota via increased microbial infection of invertebrates and fish.
Microbial increases also can increase organic matter quality and decomposition. Improved organic matter quality may benefit organisms that feed upon it (like shredders), but shifts from coarse to fine particulate organic matter may benefit organisms which feed upon smaller particles (e.g., collectors). Increased microbial production also may reduce dissolved oxygen concentrations due to increased heterotrophic respiration and decomposition.
Perhaps the most evident and common effect of increasing nutrient levels in streams is an increase in primary producer biomass or production. When more nutrients are present, more periphyton, macrophytes and phytoplankton can grow (center of diagram), assuming light levels are adequate.
This increase in plant material can influence other organisms via several pathways. First, plant photosynthesis and respiration both may increase. Enhanced photosynthesis can lead to supersaturated dissolved oxygen concentrations, which can cause gas bubble disease and adversely affect biota (especially fish).
In contrast, increased respiration by plants will consume oxygen, and may drive dissolved oxygen concentrations below critical levels, especially at times when photosynthesis is limited. Ultimately, decreases in dissolved oxygen concentrations may lead to loss of taxa intolerant of low dissolved oxygen levels and increases in tolerant species. Blooms of certain algal taxa also may result in increased production and release of toxins that can affect fish or invertebrates.
For N, increased photosynthesis may have an added adverse affect. Photosynthesis leads to an increase in pH, which may increase the amount of ammonium hydroxide present in streams. This compound can be extremely toxic to aquatic organisms, especially fish.
Increases in primary producers can directly affect both food quantity and food quality. Most obviously, increased plant production can mean increased food for herbivores and detritivores. However, plant responses to nutrient enrichment often are taxon-specific. Based on the total and relative amounts of N and P present, certain plant taxa may increase while others decrease, leading to changes in plant assemblage structure (lower right). Thus, increases in plant production do not necessarily translate to increases in food availability.
In the P diagram, for example, when excess P is supplied, the N:P ratio decreases. As a result, algae taxa capable of fixing N2gas may be favored, as they have a source of N not readily available to other taxa. Many of these taxa may be less palatable or inedible.
Filamentous algae may become more dominant with nutrient enrichment, and more prostrate forms may be shaded out. These shifts can lead to a decrease in overall algal richness or evenness, and ultimately may affect herbivore assemblages. Changes in plant assemblage structure also can affect habitat structure, for example by changing the availability of refugia or the trapping of fine organic matter particles.
In larger streams and rivers with significant phytoplankton communities, phytoplankton blooms (lower right) may have adverse consequences for biota. For example, increases in suspended organic matter can increase turbidity, which may reduce light penetration and benthic plant abundance. Turbidity increases also may lead to decreased visibility and potentially cause problems for visual predators. However, filtering organisms may benefit from increases in suspended organic matter.
Each of these pathways ultimately may contribute to biological impairment of stream biota. Total invertebrate richness or evenness may decline or specific taxa may be lost, and changes in any one population may indirectly affect other taxa.
You may need a PDF reader to view some of the files on this page. See EPA’s About PDF page to learn more.
- APHA (American Public Health Association), AWWA (American Water Works Association), WEF (Water Environment Federation) (1998) Standard Methods for the Examination of Water and Wastewater (20th edition). American Public Health Association, Washington DC.
- ASTM (1999) Annual Book of ASTM Standards. American Society for Testing and Materials, Philadelphia PA.
- Barbour MT, Gerritsen J, Griffith GE, Frydenborg R, McCarron E, White JS, Bastian ML (1996) A framework for biological criteria for Florida streams using benthic macroinvertebrates. Journal of the North American Benthological Society 15:185-211.
- Barbour MT, Gerritsen J, Snyder BD, Stribling JB (1999) Rapid bioassessment protocols for use in wadeable streams and rivers: periphyton, benthic macroinvertebrates, and fish (2nd edition). U.S. Environmental Protection Agency, Office of Water, Washington DC. EPA 841-B-99-002.
- Carlson RE, Simpson J (1996) A Coordinator's Guide to Volunteer Lake Monitoring Methods. North American Lake Management Society. 96 pp.
- Clarke KR, Warwick RM (1994) Change in Marine Communities: An Approach to Statistical Analysis and Interpretation. Plymouth Marine Laboratory, National Research Council.
- Deshon JE (1995) Development and application of the Invertebrate Community Index (ICI). Pp. 217-243 in: David WS, Simon TP (Eds). Biological Criteria and Assessment: Tools for Risk-Based Planning and Decision Making. Lewis Publishers, Boca Raton FL.
- Dodds WK, Welch EB (2000) Establishing nutrient criteria in streams. Journal of the North American Benthological Society 19(1):186-196.
- Griffith MB, Hill BH, McCormick FH, Kaufmann PR, Herlihy AT, Selle AR (1995) Comparative application of indices of biotic integrity based on periphyton, macroinvertebrates, and fish to southern Rocky Mountain streams. Ecological Indicators 5:117-136.
- Klemm DJ, Blocksom KA, Fulk FA, Herlihy AT, Hughes RM, Kaufmann PR, Peck DV, Stoddard JL, Thoeny WT, Griffith MB, Davis WS (2003) Development and evaluation of a macroinvertebrate biotic integrity index (MBII) for regionally assessing Mid-Atlantic Highlands streams. Environmental Management 31:656-669.
- Legendre P, Legendre L (1998) Numerical Ecology (2nd English edition). Elsevier, Amsterdam, Netherlands.
- McCune B, Grace JB, Urban DL (2002) Analysis of Ecological Communities. MjM Software Design, Gleneden Beach OR.
- Miltner RJ, Rankin ET (1998) Primary nutrients and the biotic integrity of rivers and streams. Freshwater Biology 40:145-158.
- National Research Council (2000) Clean Coastal Waters: Understanding and Reducing the Effects of Nutrient Pollution. National Academy Press, Washington DC.
- USGS (1999) The Quality of Our Nation's Waters: Nutrients and Pesticides. U.S. Geological Survey. Circular 1225. 82 pp.
- van Dam H, Mertens A, Sindeldam J (1994) A coded checklist and ecological indicator values of freshwater diatoms from the Netherlands. Netherlands Journal of Aquatic Ecology 28:117-133.
- Weitzel RL (Ed.) (1979) Methods and Measurements of Periphyton Communities: A Review. American Society for Testing and Materials, Philadelphia PA. ASTM STP 690.
- Wetzel RG (2001) Limnology (3rd edition). Academic Press, San Diego CA.
Contacts: Authors & Contributors