Regional Profile for EPA Region 10
This section examines TRI reporting in EPA Region 10. Region 10 includes Alaska, Idaho, Oregon, Washington, and 271 tribes.
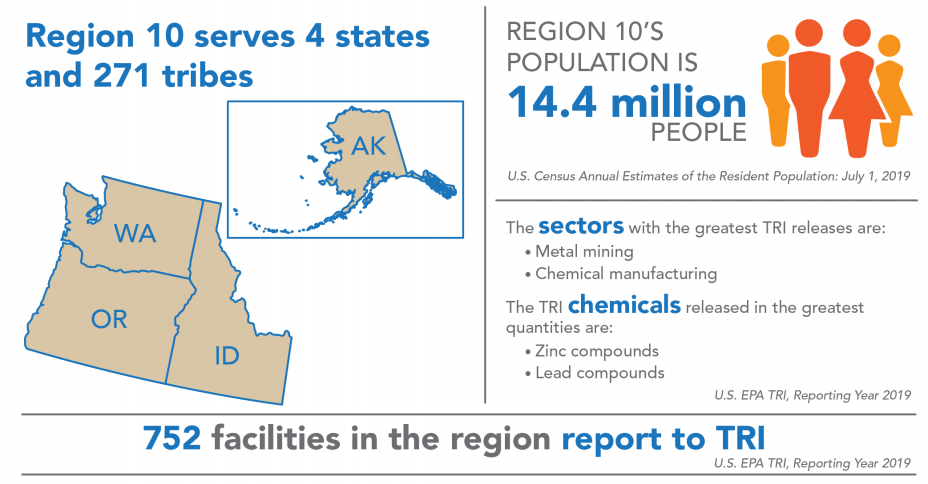
Region 10 covers 4% of the U.S. population and includes 4% of all facilities that report to TRI. For state- and tribe-specific TRI data, see the Where You Live section and the Tribal Communities section. Sixteen facilities located on the land of five different tribes in Region 10 reported to TRI for 2019.
Industry Sectors
This chart shows the industry sectors with the most TRI-reporting facilities in Region 10.
Note: Percentages do not sum to 100% due to rounding.
In 2019:
- 752 facilities in Region 10 reported to TRI, similar to reporting for 2018. These facilities were most commonly in the nonmetallic mineral products (including concrete manufacturing) or wood product manufacturing sectors.
- While the figure shows the sectors with the most TRI facilities in the region, the most TRI releases in Region 10 were from the metal mining sector, which accounted for 93% of the region’s releases for 2019. After metal mining, the chemical manufacturing, food manufacturing, and paper manufacturing sectors reported the largest releases. Note that relatively few facilities in the metal mining sector or paper manufacturing sectors reported to TRI in this region and those sectors are included in “All Other Sectors” in the pie chart above.
- Nationwide, the metal mining, chemical manufacturing, electric utilities, and primary metals (including iron and steel manufacturing, and foundries) sectors reported the largest releases.
- Metal mining facilities typically handle large volumes of material. In this sector, even a small change in the chemical composition of the mineral deposit being mined can lead to big changes in the amount of TRI-listed chemicals reported. Therefore, releases in Region 10, where 10 metal mines reported to TRI for 2019, may not follow national trends. For more information on the metal mining sector, see the metal mining sector profile.
For information on the Region 10 facilities with the largest releases, see the Region 10 TRI Factsheet.
TRI Waste Management Trend
The following graph shows the annual quantities of TRI chemicals in production-related waste managed![]() production-related wasteThe sum of all non-accidental chemical waste generated at a facility. It is the sum of on-site environmental releases (minus quantities from non-routine, one-time events), on-site waste management (recycling, treatment, and combustion for energy recovery), and off-site transfers for disposal, treatment, recycling or energy recovery. by facilities located in Region 10. For more details on quantities released, toggle to the Releases graph.
production-related wasteThe sum of all non-accidental chemical waste generated at a facility. It is the sum of on-site environmental releases (minus quantities from non-routine, one-time events), on-site waste management (recycling, treatment, and combustion for energy recovery), and off-site transfers for disposal, treatment, recycling or energy recovery. by facilities located in Region 10. For more details on quantities released, toggle to the Releases graph.
Note: For comparability, trend graphs include only those chemicals that were reportable to TRI for all years presented.
In 2019:
- Facilities in Region 10 managed 1.25 billion pounds of production-related waste, 74% of which was disposed of or otherwise released, compared to 11% nationally. Metal mines drive the quantity of production-related waste released in Region 10. For 2019, metal mines in the region disposed of more than 99% of their waste on site to land. The 1.25 billion pounds of production-related waste includes all chemicals reported for 2019, while for comparability over time, the trend chart excludes chemicals that were added to the TRI list after 2007.
- Since 2018, quantities of production-related waste managed in the region decreased by 9%, driven by decreased releases from metal mines. Excluding metal mines, production-related waste managed in Region 10 decreased by 9 million pounds (-3%).
From 2007 to 2019:
- Total production-related waste managed increased by 161 million pounds (16%), driven by increased releases reported by metal mines. Nationally, quantities of production-related waste managed increased by 23%, driven by increased recycling.
- Excluding metal mines, production-related waste managed in the region decreased by 78.4 million pounds (-19%).
The following graph shows the annual quantities of TRI chemicals released by facilities located in Region 10.
Note: For comparability, trend graphs include only those chemicals that were reportable to TRI for all years presented.
In 2019:
Regional Highlight
TRI chemical releases in Region 10 are dominated by one metal mine. For 2019, the Red Dog mine in Alaska reported 83% of the region’s releases [View facility details].
- Facilities in Region 10 reported releasing 932 million pounds of TRI chemicals.
- The chemicals released in the largest quantities by medium were:
- ammonia and methanol to air;
- nitrate compounds to water;
- zinc compounds and lead compounds to land; and
- nitrate compounds and ethylene glycol transferred off site for disposal.
- Since 2018, releases decreased by 128 million pounds (-12%), compared to a 9% decrease nationally. The decrease in Region 10 releases was driven by the metal mining sector.
- Excluding metal mining, releases decreased by 855,000 pounds (-1%) since 2018.
- Contributions by state to TRI releases in Region 10 were: Alaska (91%), Idaho (4%), Washington (3%), and Oregon (2%).
- To consider the potential health risk from chronic exposure to these releases, EPA provides a risk-screening score from the RSEI model. Contributions by state to the RSEI Score for Region 10 were: Oregon (84%), Washington (15%), Idaho (<1%), and Alaska (<1%).
- The RSEI model accounts for factors such as chemical properties and population density in addition to the pounds of TRI chemicals released. Additionally, RSEI does not model land disposal quantities, which drive the high release quantities for Alaska. These factors can lead to significant differences between a state’s contribution to regional releases and its contribution to the regional RSEI Score.
From 2007 to 2019:
- Releases in Region 10 increased by 204 million pounds (28%), compared to a national decrease of 19%. The increase in Region 10 releases was driven by the metal mining sector, and if the sector is excluded, releases decreased by 35.3 million pounds (-35%).
- Quantities of chemicals released to every medium except air increased.
Source Reduction
In 2019, 4% of facilities in Region 10 (30 facilities) reported implementing new source reduction activities. As one example of source reduction in Region 10, a plastics plumbing fixture manufacturer began using a production line which uses a polymeric thermoset resin that does not contain styrene. This decreased the facility’s styrene usage, waste generated, and air emissions. [Click to view facility details in the TRI P2 Search Tool].
This page was published in January 2021 and uses the 2019 TRI National Analysis dataset made public in TRI Explorer in October 2020.