Regional Profile for EPA Region 4
This section examines TRI reporting in EPA Region 4. Region 4 includes Alabama, Florida, Georgia, Kentucky, Mississippi, North Carolina, South Carolina, Tennessee, and 6 tribes.
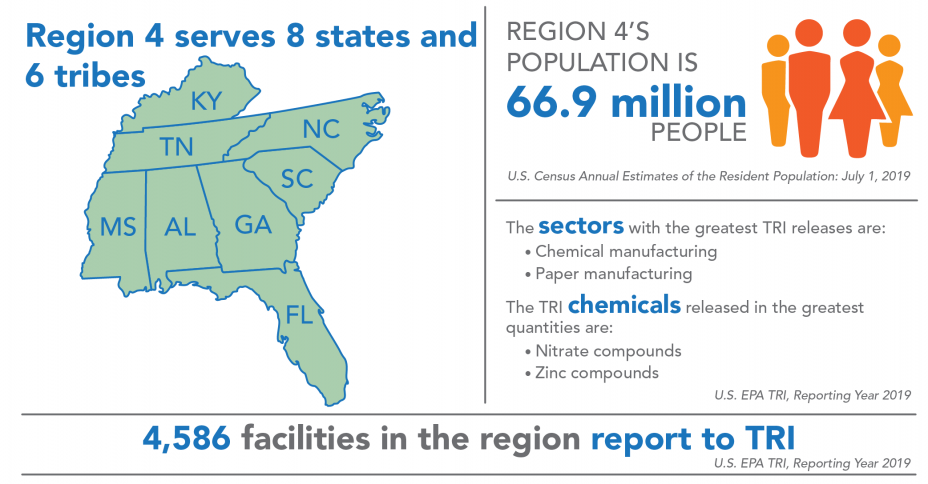
Region 4 covers 20% of the U.S. population and includes 21% of all facilities that report to TRI. For state- and tribe-specific TRI data, see the Where You Live section and the Tribal Communities section. One facility located on tribal land in Region 4 reported to TRI for 2019.
Industry Sectors
This chart shows the industry sectors with the most TRI-reporting facilities in Region 4.
Note: Percentages do not sum to 100% due to rounding
In 2019:
- 4,586 facilities in Region 4 reported to TRI, similar to reporting for 2018. These facilities were most commonly in the nonmetallic mineral products (including cement and concrete manufacturing) or chemical manufacturing sectors.
- While the figure shows the sectors with the most TRI facilities in the region, the sectors that reported the largest TRI releases in Region 4 were the chemical manufacturing, paper manufacturing, electric utilities, and primary metals (including iron and steel mills and foundries) sectors. Note that relatively few facilities in the paper manufacturing and electric utilities sectors reported to TRI in this region and those sectors are included in “All Other Sectors” in the pie chart above. Nationwide, the metal mining, chemical manufacturing, primary metals, electric utilities, and paper manufacturing sectors reported the largest releases.
For information on the Region 4 facilities with the largest releases, see the Region 4 TRI Factsheet.
TRI Waste Management Trend
The following graph shows the annual quantities of TRI chemicals in production-related waste managed![]() production-related wasteThe sum of all non-accidental chemical waste generated at a facility. It is the sum of on-site environmental releases (minus quantities from non-routine, one-time events), on-site waste management (recycling, treatment, and combustion for energy recovery), and off-site transfers for disposal, treatment, recycling or energy recovery. by facilities located in Region 4. For more details on quantities released, toggle to the Releases graph.
production-related wasteThe sum of all non-accidental chemical waste generated at a facility. It is the sum of on-site environmental releases (minus quantities from non-routine, one-time events), on-site waste management (recycling, treatment, and combustion for energy recovery), and off-site transfers for disposal, treatment, recycling or energy recovery. by facilities located in Region 4. For more details on quantities released, toggle to the Releases graph.
Note: For comparability, trend graphs include only those chemicals that were reportable to TRI for all years presented.
In 2019:
- Facilities in Region 4 managed 5.72 billion pounds of production-related waste, 92% of which was recycled, combusted for energy recovery, or treated. Only 8% was disposed of or otherwise released into the environment in Region 4, compared to 11% nationally.
- Since 2018, quantities of production-related waste managed in the region decreased by 9%, with reductions in every waste management method (i.e., recycling, energy recovery, treatment, and releases).
From 2007 to 2019:
- Production-related waste managed increased by 576 million pounds (11%), driven by one facility that reported recycling over 1.5 billion pounds of dichloromethane (methylene chloride) during 2018 and 2019. [Click to view facility details in the TRI P2 Search Tool]. Excluding this facility, production-related waste managed in the region decreased by 1.1 billion pounds (-22%), and quantities of waste managed by every method (i.e., recycling, treatment, energy recovery, and disposal and releases) decreased.
- Nationally, quantities of production-related waste managed increased by 23%, driven by increased recycling.
The following graph shows the annual quantities of TRI chemicals released by facilities located in Region 4.
Note: For comparability, trend graphs include only those chemicals that were reportable to TRI for all years presented.
In 2019:
Regional Highlight
On-site releases to air in Region 4 decreased by 65% since 2007. The largest decrease was reported by electric utilities, which continued to report decreased releases to air from 2018 to 2019.
- Facilities in Region 4 reported releasing 462 million pounds of TRI chemicals.
- The chemicals released in the largest quantities by medium were:
- To air: methanol and ammonia;
- To water: nitrate compounds;
- To land: manganese compounds and zinc compounds; and
- Transferred off site for disposal: zinc compounds and manganese compounds.
- Since 2018, releases decreased by 25.4 million pounds (-5%), driven by decreased releases to land and air. Nationally, releases decreased by 9%.
- Contributions by state to TRI releases in Region 4 were: Tennessee (18%), Alabama (17%), North Carolina (12%), Mississippi (12%), Florida (12%), Georgia (11%), Kentucky (10%), and South Carolina (8%).
- To consider the potential health risk from chronic exposure to these releases, EPA provides a risk-screening score from the RSEI model. Contributions by state to the RSEI Score for Region 4 were: Tennessee (24%), Florida (18%), Alabama (14%), Georgia (13%), North Carolina (12%), Kentucky (10%), South Carolina (8%), and Mississippi (2%).
- The RSEI model accounts for factors such as chemical properties and population density in addition to the pounds of TRI chemicals released. Additionally, RSEI does not model land disposal quantities. These factors can lead to significant differences between a state’s contribution to regional releases and its contribution to the regional RSEI Score.
From 2007 to 2019:
- Releases in Region 4 decreased by 392 million pounds (-47%), compared to a 19% decrease nationally.
- Quantities of chemicals released to air, water, and land, and transferred off-site for disposal all decreased, with the largest reduction in releases to air.
Source Reduction
In 2019, 6% of facilities in Region 4 (257 facilities) reported implementing new source reduction activities. Source reduction reporting rates in the region were among the highest in the computers/electronic products manufacturing sector, in which 19% of facilities reported source reduction activities. As one example of source reduction in Region 4, an electronic assembly facility reported that current mass production units are no longer manufactured using lead solder and that lead waste is contained in a limited number of service parts. Production of these service parts has decreased in the last year. [Click to view facility details in the TRI P2 Search Tool].
This page was published in January 2021 and uses the 2019 TRI National Analysis dataset made public in TRI Explorer in October 2020.