Regional Profile for EPA Region 3
This section examines TRI reporting in EPA Region 3. Region 3 includes Delaware, the District of Columbia, Maryland, Pennsylvania, Virginia, West Virginia, and 7 tribes.
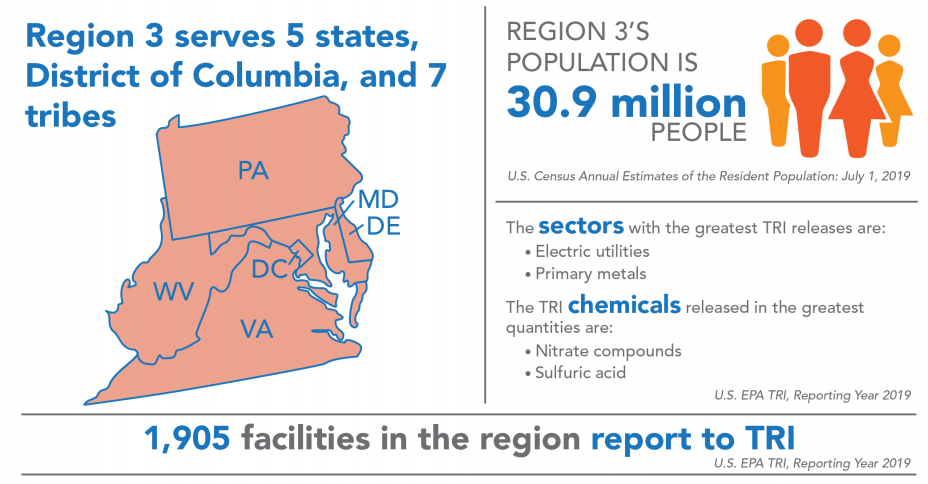
Region 3 covers 9% of the US population and includes 9% of all facilities that report to TRI. For state- and tribe-specific TRI data, see the Where You Live section and the Tribal Communities section. Although Region 3 includes 7 tribes, no facilities located on tribal lands in the region reported to TRI for 2019.
Industry Sectors
This chart shows the industry sectors with the most TRI-reporting facilities in Region 3.
Note: Percentages do not sum to 100% due to rounding
In 2019:
- 1,905 facilities in Region 3 reported to TRI, similar to reporting for 2018. These facilities were most commonly in the fabricated metals (i.e., manufacture of metal products) or chemical manufacturing sectors.
- While the figure shows the sectors with the most TRI facilities in the region, the sectors that reported the largest TRI releases in Region 3 were the electric utilities, primary metals (including iron and steel manufacturing, and foundries), and petroleum products manufacturing. Note that relatively few facilities in the electric utilities and petroleum products sectors reported to TRI in this region and those sectors are included in “All Other Sectors” in the pie chart above.
- Nationwide, the metal mining, chemical manufacturing, primary metals, and electric utilities sectors reported the largest releases.
For information on the facilities with the greatest releases in the region, see the Region 3 TRI Factsheet.
TRI Waste Management Trend
The following graph shows the annual quantities of TRI chemicals in production-related waste managed![]() production-related wasteThe sum of all non-accidental chemical waste generated at a facility. It is the sum of on-site environmental releases (minus quantities from non-routine, one-time events), on-site waste management (recycling, treatment, and combustion for energy recovery), and off-site transfers for disposal, treatment, recycling or energy recovery. by facilities located in Region 3. For more details on quantities released, toggle to the Releases graph.
production-related wasteThe sum of all non-accidental chemical waste generated at a facility. It is the sum of on-site environmental releases (minus quantities from non-routine, one-time events), on-site waste management (recycling, treatment, and combustion for energy recovery), and off-site transfers for disposal, treatment, recycling or energy recovery. by facilities located in Region 3. For more details on quantities released, toggle to the Releases graph.
Note: For comparability, trend graphs include only those chemicals that were reportable to TRI for all years presented.
In 2019:
- Facilities in Region 3 managed 5.8 billion pounds of production-related waste, 81% of which was recycled, compared to 53% nationally.
- Since 2018, production-related waste managed in the region decreased by 324 million pounds (-5%), driven by reductions in the quantities of waste recycled and treated.
From 2007 to 2019:
- Total production-related waste managed increased by 2.9 billion pounds (117%), driven by one facility which reported that it recycled over 3 billion pounds of cumene each year from 2014 to 2019. [Click to view facility details in the TRI P2 Search Tool].
- Excluding this facility, production-related waste managed in the region decreased by 699 million pounds (-28%).
- Nationally, quantities of production-related waste managed increased by 23% since 2007, driven by increased recycling.
The following graph shows the annual quantities of TRI chemicals released by facilities located in Region 3.
Note: For comparability, trend graphs include only those chemicals that were reportable to TRI for all years presented.
In 2019:
Regional Highlight
The decrease in chemical releases for 2019 in Region 3 was driven by a reduction in releases to air and off-site transfers for disposal from the electric utilities sector.
- Facilities in Region 3 reported releasing 124 million pounds of TRI chemicals.
- The chemicals released in the largest quantities by medium were:
- To air: sulfuric acid;
- To water: nitrate compounds;
- To land: lead compounds and manganese compounds; and
- Transferred off site for disposal: zinc compounds and manganese compounds.
- Since 2018, releases decreased by 11.4 million pounds (-8%), primarily driven by air releases and off-site transfers for disposal, though releases to land and water also decreased slightly. Nationally, releases decreased by 9%.
- Contributions by state to TRI releases in Region 3 were: Pennsylvania (41%), Virginia (28%), West Virginia (22%), Delaware (5%), and Maryland (4%).
- To consider the potential health risk from chronic exposure to these releases, EPA provides a risk-screening score from the RSEI model. Contributions by state to the RSEI Score for Region 3 were: Pennsylvania (62%), Virginia (14%), West Virginia (9%), Delaware (8%), and Maryland (1%).
- The RSEI model accounts for factors such as chemical properties and population density in addition to the pounds of TRI chemicals released. Additionally, RSEI does not model land disposal quantities. These factors can lead to significant differences between a state’s contribution to regional releases and its contribution to the regional RSEI Score.
From 2007 to 2019:
- Releases in Region 3 decreased by 270 million pounds (-69%), compared to a 19% decrease nationally.
- Quantities of chemicals released to air, water, and land, and transfers off-site for disposal all decreased, with a 181-million-pound reduction in air releases driving the overall decrease.
Source Reduction
In 2019, 7% of facilities in Region 3 (130 facilities) reported implementing new source reduction activities. Source reduction reporting rates in the region were among the highest in the plastics/rubber manufacturing sector, where 14% of facilities reported source reduction activities. For example, a foam products manufacturer implemented spill prevention solutions to reduce the loss of nitrate compounds through spills or leaks. The facility also began electronically tracking maintenance activities to improve scheduling and recordkeeping procedures. [Click to view facility details in the TRI P2 Search Tool].
This page was published in January 2021 and uses the 2019 TRI National Analysis dataset made public in TRI Explorer in October 2020.