Regional Profile for EPA Region 7
This section examines TRI reporting in EPA Region 7. Region 7 includes Iowa, Kansas, Missouri, Nebraska, and 9 tribes.
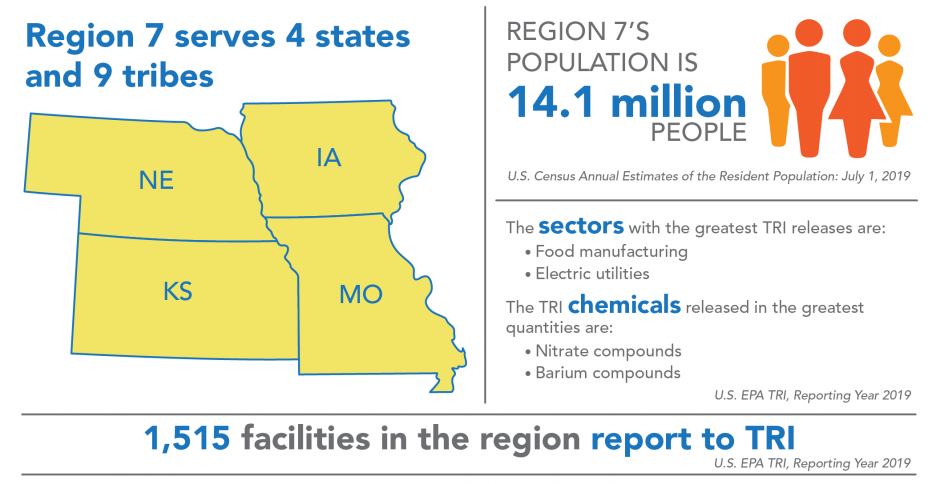
Region 7 covers 4% of the U.S. population and includes 7% of all facilities that report to TRI. For state- and tribe-specific TRI data, see the Where You Live section and the Tribal Communities section. Although Region 7 includes 9 tribes, no facilities located on tribal lands in the region reported to TRI for 2019.
Industry Sectors
This chart shows the industry sectors with the most TRI-reporting facilities in Region 7.
Note: Percentages do not sum to 100% due to rounding.
In 2019:
- 1,515 facilities in Region 7 reported to TRI, similar to reporting for 2018. These facilities were most commonly in the chemical manufacturing or food manufacturing sectors.
- While the figure shows the sectors with the most TRI facilities in the region, the sectors that reported the largest TRI releases in Region 7 were the food manufacturing, electric utilities, chemical manufacturing, and metal mining sectors. Note that relatively few facilities in the electric utilities and metal mining sectors reported to TRI in this region and those sectors are included in “All Other Sectors” in the pie chart above. Nationwide, the metal mining, chemical manufacturing, primary metals (including iron and steel manufacturing, and foundries), and electric utilities sectors reported the largest releases.
For information on the Region 7 facilities with the largest releases, see the Region 7 TRI Factsheet.
TRI Waste Management Trend
The following graph shows the annual quantities of TRI chemicals in production-related waste managed![]() production-related wasteThe sum of all non-accidental chemical waste generated at a facility. It is the sum of on-site environmental releases (minus quantities from non-routine, one-time events), on-site waste management (recycling, treatment, and combustion for energy recovery), and off-site transfers for disposal, treatment, recycling or energy recovery. by facilities located in Region 7. For more details on quantities released, toggle to the Releases graph.
production-related wasteThe sum of all non-accidental chemical waste generated at a facility. It is the sum of on-site environmental releases (minus quantities from non-routine, one-time events), on-site waste management (recycling, treatment, and combustion for energy recovery), and off-site transfers for disposal, treatment, recycling or energy recovery. by facilities located in Region 7. For more details on quantities released, toggle to the Releases graph.
Note: For comparability, trend graphs include only those chemicals that were reportable to TRI for all years presented.
In 2019:
- Facilities in Region 7 managed 1.01 billion pounds of production-related waste, 89% of which was recycled, combusted for energy recovery, or treated. 11% was disposed of or otherwise released into the environment, which is consistent with the proportion of production-related waste released into the environment nationally. The 1.01 billion pounds of production-related waste includes all chemicals reported for 2019, while for comparability over time, the trend chart excludes chemicals that were added to the TRI list after 2007.
- Since 2018, quantities of production-related waste managed in the region decreased by 8%, which was driven by reduced waste combusted for energy recovery.
From 2007 to 2019:
- Production-related waste managed decreased by 92.6 million pounds (-9%). Quantities of waste recycled, treated, and disposed of or otherwise released all decreased, while quantities of waste combusted for energy recovery increased. Nationally, quantities of production-related waste managed increased by 23%, driven by increased recycling.
The following graph shows the annual quantities of TRI chemicals released by facilities located in Region 7.
Note: For comparability, trend graphs include only those chemicals that were reportable to TRI for all years presented.
In 2019:
Regional Highlight
Releases in Region 7 decreased from 2018 to 2019 primarily due to reduced releases from the electric utilities and metal mining sectors.
- Facilities in Region 7 reported releasing 138 million pounds of TRI chemicals.
- The chemicals released in the largest quantities by medium were:
- To air: ammonia and n-hexane;
- To water: nitrate compounds;
- To land: lead compounds and barium compounds; and
- Transferred off site for disposal: nitrate compounds.
- Since 2018, releases decreased by 7.0 million pounds (5%). Releases increased to all media except land. Nationally, releases decreased by 9%.
- Contributions by state to TRI releases in Region 7 were: Missouri (40%), Iowa (29%), Kansas (18%), and Nebraska (13%).
- To consider the potential health risk from chronic exposure to these releases, EPA provides a risk-screening score from the RSEI model. Contributions by state to the RSEI Score for Region 7 were: Missouri (34%), Kansas (33%), Iowa (27%), and Nebraska (6%).
- The RSEI model accounts for factors such as chemical properties and population density in addition to the pounds of TRI chemicals released. Additionally, RSEI does not model land disposal quantities. These factors can lead to significant differences between a state’s contribution to regional releases and its contribution to the regional RSEI Score.
From 2007 to 2019:
- Releases in Region 7 decreased by 86.9 million pounds (-39%). This decrease was driven by a reduction in releases from the primary metals and metal mining sectors. Nationally, releases decreased by 19%.
- Quantities of chemicals released to air, water, and land, and transferred off site for disposal all decreased.
Source Reduction
In 2019, 4% of facilities in Region 7 (65 facilities) reported implementing new source reduction activities. Source reduction reporting rates in the region were among the highest in the electrical equipment sector, where 16% of facilities reported source reduction activities. For example, a carbon fiber manufacturer reduced its styrene usage by moving to smaller bath sizes which reduced the amount of resin used and limited losses during production. [Click to view facility details in the TRI P2 Search Tool].
This page was published in January 2021 and uses the 2019 TRI National Analysis dataset made public in TRI Explorer in October 2020.