Regional Profile for EPA Region 2
This section examines TRI reporting in EPA Region 2. Region 2 includes New Jersey, New York, Puerto Rico, US Virgin Islands, and 8 tribes.
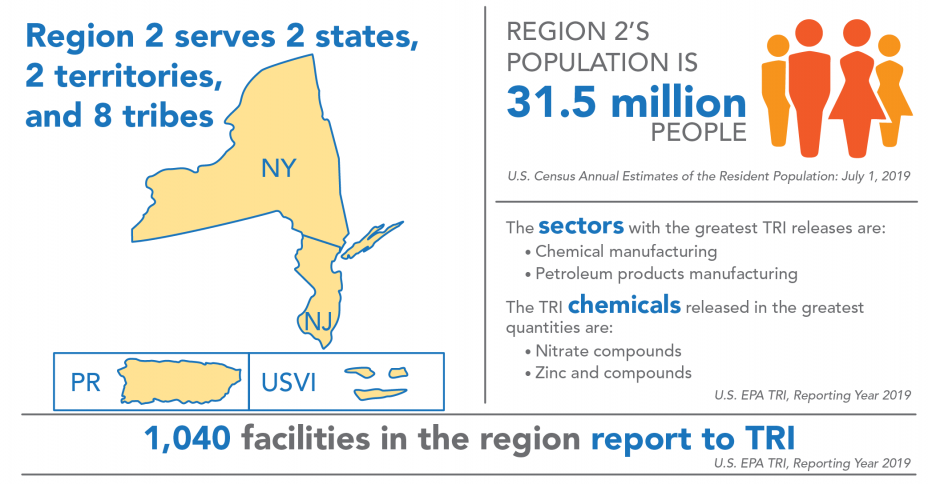
Region 2 covers 10% of the U.S. population and includes 5% of all facilities that report to TRI. For state- and tribe-specific TRI data, see the Where You Live section and the Tribal Communities section. Although Region 2 includes 8 tribes, no facilities located on tribal lands in the region reported to TRI for 2019.
Industry Sectors
This chart shows the industry sectors with the most TRI-reporting facilities in Region 2.
In 2019:
- 1,040 facilities in Region 2 reported to TRI, similar to reporting for 2018. These facilities were most commonly in the chemical manufacturing or fabricated metals (i.e., manufacture of metal products) sectors.
- While the figure shows the sectors with the most TRI facilities in the region, the sectors that reported the largest TRI releases in Region 2 were the chemical manufacturing, petroleum products manufacturing, hazardous waste management, primary metals (including iron and steel manufacturing, and foundries), and electric utilities sectors. Note that relatively few facilities in the petroleum products and hazardous waste management sectors reported to TRI in this region and those sectors are included in “All Other Sectors” in the pie chart above.
- Nationwide, the metal mining, chemical manufacturing, primary metals, and electric utilities sectors reported the largest releases.
For information on the Region 2 facilities with the largest releases, see the TRI Region 2 TRI factsheet.
TRI Waste Management Trend
The following graph shows the annual quantities of TRI chemicals in production-related waste managed![]() production-related wasteThe sum of all non-accidental chemical waste generated at a facility. It is the sum of on-site environmental releases (minus quantities from non-routine, one-time events), on-site waste management (recycling, treatment, and combustion for energy recovery), and off-site transfers for disposal, treatment, recycling or energy recovery. by facilities located in Region 2. For more details on quantities released, toggle to the Releases graph.
production-related wasteThe sum of all non-accidental chemical waste generated at a facility. It is the sum of on-site environmental releases (minus quantities from non-routine, one-time events), on-site waste management (recycling, treatment, and combustion for energy recovery), and off-site transfers for disposal, treatment, recycling or energy recovery. by facilities located in Region 2. For more details on quantities released, toggle to the Releases graph.
Note: For comparability, trend graphs include only those chemicals that were reportable to TRI for all years presented. Total production-related waste managed reported for 2019 in Region 2 was higher than shown here due to large treatment quantities of hydrogen sulfide, which was not TRI-reportable until 2012.
In 2019:
- Facilities in Region 2 managed 821 million pounds of production-related waste, 95% of which was recycled, combusted for energy recovery, or treated. Only 5% was disposed of or otherwise released into the environment in Region 2, compared to 11% nationally. The 821 million pounds of production-related waste includes all chemicals reported for 2019, while for comparability over time, the trend chart excludes chemicals that were added to the TRI list after 2007. For Region 2, the difference for 2019 is primarily due to the quantity of hydrogen sulfide treated which is included in the 821 million pound total for 2019 but is excluded from the trend chart. TRI reporting of hydrogen sulfide began in 2012.
- The chart above shows a 2% decrease in production-related waste managed since 2018. This excludes chemicals that were added to the TRI chemical list after 2007. Including those chemicals, quantities of production-related waste managed in Region 2 increased by 64 million pounds (9%) since 2018, driven by increased treatment of hydrogen sulfide.
From 2007 to 2019:
- Production-related waste managed decreased by 97.8 million pounds (-15%). Quantities of waste treated, combusted for energy recovery, and disposed of or otherwise released decreased, while quantities recycled increased. Nationally, quantities of production-related waste managed increased by 23%.
The following graph shows the annual quantities of TRI chemicals released by facilities located in Region 2.
Note: For comparability, trend graphs include only those chemicals that were reportable to TRI for all years presented.
In 2019:
Regional Highlight
Variability in TRI chemical releases in Region 2 is due to changes in releases reported by hazardous waste management facilities, where release quantities can vary widely year to year.
- Facilities in Region 2 reported releasing 39.3 million pounds of TRI chemicals.
- The chemicals released in the largest quantities by medium were:
- To air: ammonia and sulfuric acid;
- To water: nitrate compounds;
- To land: asbestos; and
- Transferred off site for disposal: zinc compounds and nitrate compounds.
- Since 2018, releases decreased slightly (by less than 1%). Water releases and off-site transfers for disposal increased, while air releases and land releases decreased. Nationally, releases decreased by 9%.
- Contributions by state or territory to TRI releases in Region 2 were: New York (48%), New Jersey (36%), Puerto Rico (15%), and U.S. Virgin Islands (<1%).
- To consider the potential health risk from chronic exposure to these releases, EPA provides a risk-screening score from the RSEI model. Contributions by state or territory to the RSEI Score for Region 2 were: New Jersey (56%), New York (35%), Puerto Rico (9%), and U.S. Virgin Islands (<1%).
- The RSEI model accounts for factors such as chemical properties and population density in addition to the pounds of TRI chemicals released. Additionally, RSEI does not model land disposal quantities. These factors can lead to significant differences between a state’s contribution to regional releases and its contribution to the regional RSEI Score.
From 2007 to 2019:
- Releases in Region 2 decreased by 22.4 million pounds (-36%), driven by reduced releases from electric utilities. Nationally, releases decreased by 19%.
- Quantities of chemicals released to air, water, and land decreased, while off-site transfers for disposal increased.
- The increased releases for 2015 shown in the graph were caused by off-site transfers for disposal of several chemicals from a hazardous waste management facility in Kearny, New Jersey. [Click to view facility details in the TRI P2 Search Tool].
Source Reduction
In 2019, 9% of facilities in Region 2 (95 facilities) reported implementing new source reduction activities. Source reduction reporting rates in the region were among the highest in the miscellaneous manufacturing sector, where 14% of facilities reported source reduction activities. As one example of source reduction in Region 2, a facility began monitoring operations to improve material yields and reduce waste. [Click to view facility details in the P2 tool].
This page was published in January 2021 and uses the 2019 TRI National Analysis dataset made public in TRI Explorer in October 2020.