Regional Profile for EPA Region 6
This section examines TRI reporting in EPA Region 6. Region 6 includes Arkansas, Louisiana, New Mexico, Oklahoma, Texas, and 66 Tribes.
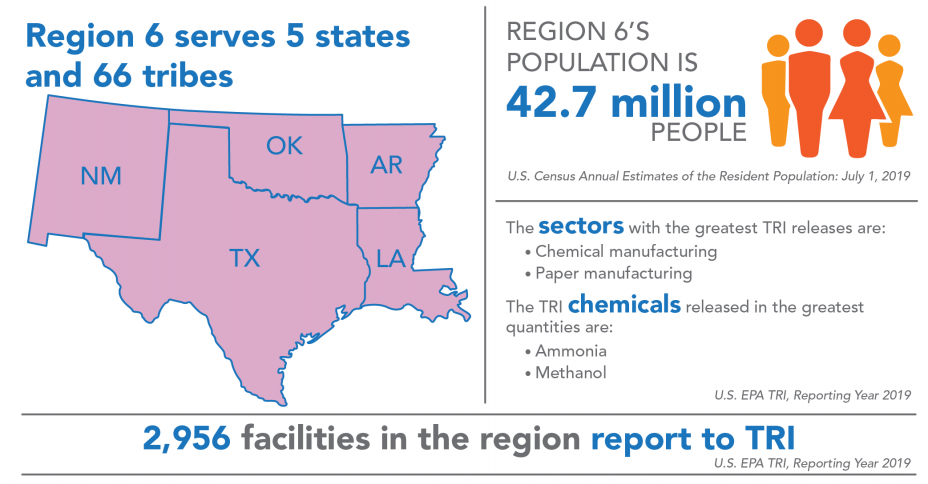
Region 6 covers 13% of the U.S. population and includes 14% of all facilities that report to TRI. For state- and tribe-specific TRI data, see the Where You Live section and the Tribal Communities section. Three facilities located on the land of two different tribes in Region 6 reported to TRI for 2019.
Industry Sectors
This chart shows the industry sectors with the most TRI-reporting facilities in Region 6.
In 2019:
- 2,956 facilities in Region 6 reported to TRI, similar to reporting for 2018. These facilities were most commonly in the chemical manufacturing or nonmetallic mineral products (including concrete manufacturing) sectors.
- While the figure shows the sectors with the most TRI facilities in the region, the sectors that reported the largest TRI releases in Region 6 were the chemical manufacturing, paper manufacturing, petroleum products manufacturing, and electric utilities sectors. Note that relatively few facilities in the paper manufacturing and electric utilities sectors reported to TRI in this region and those sectors are included in “All Other Sectors” in the pie chart above.
- Nationwide, the metal mining, chemical manufacturing, primary metals (including iron and steel manufacturing, and foundries), and electric utilities sectors reported the largest releases.
For information on Region 6 facilities with the largest releases, see the Region 6 TRI Factsheet.
TRI Waste Management Trend
The following graph shows the annual quantities of TRI chemicals in production-related waste managed![]() production-related wasteThe sum of all non-accidental chemical waste generated at a facility. It is the sum of on-site environmental releases (minus quantities from non-routine, one-time events), on-site waste management (recycling, treatment, and combustion for energy recovery), and off-site transfers for disposal, treatment, recycling or energy recovery. by facilities located in Region 6. For more details on quantities released, toggle to the Releases graph.
production-related wasteThe sum of all non-accidental chemical waste generated at a facility. It is the sum of on-site environmental releases (minus quantities from non-routine, one-time events), on-site waste management (recycling, treatment, and combustion for energy recovery), and off-site transfers for disposal, treatment, recycling or energy recovery. by facilities located in Region 6. For more details on quantities released, toggle to the Releases graph.
Note: For comparability, trend graphs include only those chemicals that were reportable to TRI for all years presented.
In 2019:
- Facilities in Region 6 managed 8.05 billion pounds of production-related waste, 41% of which was treated and 34% of which was recycled. Nationally, 26% of production-related waste was managed through treatment and 53% was recycled. The 8.05 billion pounds of production-related waste includes all chemicals reported for 2019, while for comparability over time, the trend chart excludes chemicals that were added to the TRI list after 2007.
- Since 2018, quantities of production-related waste managed in the region increased by 3%.
From 2007 to 2019:
- Production-related waste managed increased by 770 million pounds (11%), largely driven by one facility which reported 477 million pounds of recycling for 2019, compared to 6 million pounds recycled in 2007. Excluding this facility, quantities of production-related waste managed in the region increased by 303 million pounds (4%) since 2007.
- Nationally, quantities of production-related waste managed increased by 23% since 2007, driven by increased recycling.
The following graph shows the annual quantities of TRI chemicals released by facilities located in Region 6.
Note: For comparability, trend graphs include only those chemicals that were reportable to TRI for all years presented.
In 2019:
Regional Highlight
Releases to air decreased by 5.4 million pounds from 2018 to 2019, driven by reductions in the chemical manufacturing, electric utilities, and petroleum product manufacturing sectors.
- Facilities in Region 6 reported releasing 429 million pounds of TRI chemicals. The 429 million pounds of releases includes all chemicals reported for 2019, while for comparability over time, the trend chart excludes chemicals that were added to the TRI list after 2007.
- The chemicals released in the largest quantities by medium were:
- To air: ammonia and methanol;
- To water: nitrate compounds;
- To land: ammonia, barium compounds, and formaldehyde; and
- Transferred off site for disposal: manganese compounds and methanol.
- Since 2018, releases decreased by 25.9 million pounds (-6%). Releases to air and land decreased, while water discharges and off-site transfers for disposal increased. Nationally, releases decreased by 9%.
- Contributions by state to TRI releases in Region 6 were: Texas (45%), Louisiana (32%), Arkansas (12%), Oklahoma (7%), and New Mexico (4%).
- To consider the potential health risk from chronic exposure to these releases, EPA provides a risk-screening score from the RSEI model. Contributions by state to the RSEI Score for Region 6 were: Texas (75%), Louisiana (16%), Arkansas (6%), Oklahoma (4%), and New Mexico (<1%).
- The RSEI model accounts for factors such as chemical properties and population density in addition to the pounds of TRI chemicals released. Additionally, RSEI does not model land disposal quantities. These factors can lead to significant differences between a state’s contribution to regional releases and its contribution to the regional RSEI Score.
From 2007 to 2019:
- Releases in Region 6 decreased by 50.7 million pounds (-11%), compared to a 19% decrease nationally.
- Quantities of chemicals released to air and land decreased, while releases to water and off-site transfers for disposal increased.
Source Reduction
In 2019, 5% of facilities in Region 6 (153 facilities) reported implementing new source reduction activities. As one example of source reduction in Region 6, a motor vehicle parts manufacturer updated the zinc rinse system with automated equipment, which reduced zinc waste by improving the overall effectiveness of the system. [Click to view facility details in the TRI P2 Search Tool].
This page was published in January 2021 and uses the 2019 TRI National Analysis dataset made public in TRI Explorer in October 2020.