Regional Profile for EPA Region 1
This section examines TRI reporting in EPA Region 1. Region 1 includes Connecticut, Maine, Massachusetts, New Hampshire, Rhode Island, Vermont, and 10 tribes.
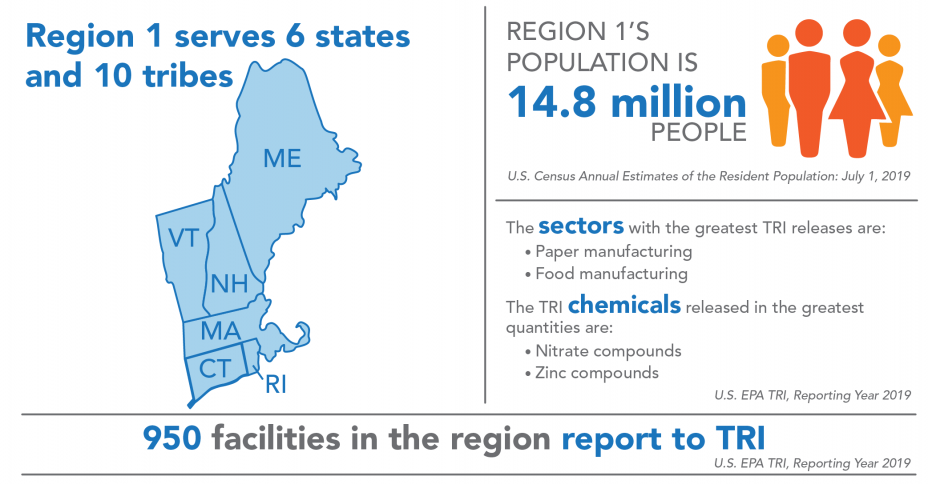
Region 1 covers 4% of the U.S. population and includes 4% of all facilities that report to TRI. For state- and tribe-specific TRI data, see the Where You Live section and the Tribal Communities section. Although Region 1 includes 10 tribes, no facilities located on tribal lands in the region reported to TRI for 2019.
Industry Sectors
This chart shows the industry sectors with the most TRI-reporting facilities in Region 1.
In 2019:
- 950 facilities in Region 1 reported to TRI, similar to reporting for 2018. These facilities were most commonly in the fabricated metals (i.e., manufacture of metal products) or chemical manufacturing sectors.
- While the figure shows the sectors with the most TRI facilities in the region, the sectors that reported the largest TRI releases in Region 1 were the paper manufacturing, food manufacturing, fabricated metals, and chemical manufacturing sectors. Note that relatively few facilities in the paper manufacturing and food manufacturing sectors reported to TRI in this region and those sectors are included in “All Other Sectors” in the pie chart above.
- Nationwide, the metal mining, chemical manufacturing, primary metals (including iron and steel manufacturing, and foundries), and electric utilities sectors reported the largest quantities of releases.
For information on the Region 1 facilities with the largest releases, see the Region 1 TRI Factsheet.
TRI Waste Management Trend
The following graph shows the annual quantities of TRI chemicals in production-related waste managed![]() production-related wasteThe sum of all non-accidental chemical waste generated at a facility. It is the sum of on-site environmental releases (minus quantities from non-routine, one-time events), on-site waste management (recycling, treatment, and combustion for energy recovery), and off-site transfers for disposal, treatment, recycling or energy recovery. by facilities located in Region 1. For more details on quantities released, toggle to the Releases graph.
production-related wasteThe sum of all non-accidental chemical waste generated at a facility. It is the sum of on-site environmental releases (minus quantities from non-routine, one-time events), on-site waste management (recycling, treatment, and combustion for energy recovery), and off-site transfers for disposal, treatment, recycling or energy recovery. by facilities located in Region 1. For more details on quantities released, toggle to the Releases graph.
Note: For comparability, trend graphs include only those chemicals that were reportable to TRI for all years presented.
In 2019:
- Facilities in Region 1 managed 309 million pounds of production-related waste, 95% of which was recycled, combusted for energy recovery, or treated. Only 5% was disposed of or otherwise released into the environment in Region 1, compared to 11% nationally.
- Since 2018, quantities of production-related waste managed in the region increased by 56%, driven by a large increase in recycling, which more than doubled from 2018 to 2019.
- The increase for 2019 is due to increased recycling of methanol by a single chemical manufacturing facility in Connecticut. [Click to view facility details in the TRI P2 Search Tool].
From 2007 to 2019:
- Production-related waste managed increased by 63.9 million pounds (26%), driven by the 2019 increase in recycling.
- Nationally, quantities of production-related waste managed increased by 23% since 2007, driven by increased recycling.
The following graph shows the annual quantities of TRI chemicals released by facilities located in Region 1.
Note: For comparability, trend graphs include only those chemicals that were reportable to TRI for all years presented.
In 2019:
Regional Highlight
Since 2007, releases in Region 1 have decreased by 42%, driven by reductions in releases to air reported by electric utilities.
- Facilities in Region 1 reported releasing 16.2 million pounds of TRI chemicals.
- The chemicals released in the largest quantities by medium were:
- To air: methanol and ammonia;
- To water: nitrate compounds;
- To land: zinc compounds and manganese compounds; and
- Transferred off site for disposal: zinc compounds and nitrate compounds
- Since 2018, releases in Region 1 decreased by 2.3 million pounds (-13%). On-site releases to air and water and off-site transfers for disposal decreased while releases to land increased. Nationally, releases decreased by 9%.
- Contributions by state to TRI releases in Region 1 were: Maine (58%), Massachusetts (19%), Connecticut (15%), Rhode Island (2%), New Hampshire (2%), and Vermont (2%).
- To consider the potential health risk from chronic exposure to these releases, EPA provides a risk-screening score from the RSEI model. Contributions by state to the RSEI Score for Region 1 were: Connecticut (66%), Massachusetts (32%), Maine (1%), Rhode Island (<1%), New Hampshire (<1%), and Vermont (<1%).
- The RSEI model accounts for factors such as chemical properties and population density in addition to the pounds of TRI chemicals released. Additionally, RSEI does not model land disposal quantities. These factors can lead to significant differences between a state’s contribution to regional releases and its contribution to the regional RSEI Score.
From 2007 to 2019:
- Releases in Region 1 decreased by 11.5 million pounds (-42%), driven by reduced air releases from electric utilities. Nationally, releases decreased by 19%.
- Quantities of chemicals released to air, water and land decreased, while quantities of chemicals transferred off site for disposal increased.
Source Reduction
In 2019, 9% of facilities in Region 1 (82 facilities) reported implementing new source reduction activities. Source reduction reporting rates were among the highest in the computer/electronic products sector, in which 22% of facilities reported source reduction activities. For example, one circuit board manufacturer reduced its use of formaldehyde by optimizing the process control module that analyzes bath conditions and monitors the chemistry needed to maintain proper conditions. [Click to view facility details in the TRI P2 Search Tool].
This page was published in January 2021 and uses the 2019 TRI National Analysis dataset made public in TRI Explorer in October 2020.