Regional Profile for EPA Region 5
This section examines TRI reporting in EPA Region 5. Region 5 includes Illinois, Indiana, Michigan, Minnesota, Ohio, Wisconsin, and 35 tribes.
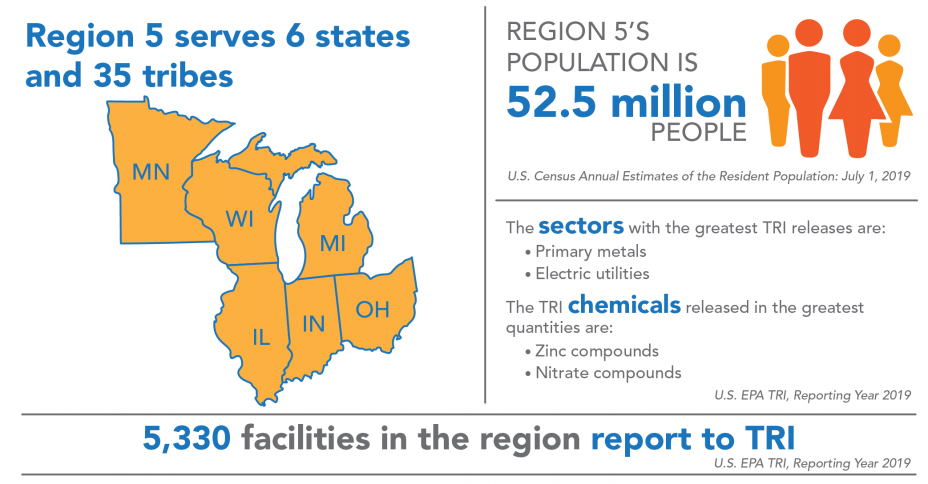
Region 5 covers 16% of the U.S. population and includes 25% of all facilities that report to TRI. For state- and tribe-specific TRI data, see the Where You Live section and the Tribal Communities section. Five facilities located on the land of two different tribes in Region 5 reported to TRI for 2019.
Industry Sectors
This chart shows the industry sectors with the most TRI-reporting facilities in Region 5.
Note: Percentages do not sum to 100% due to rounding
In 2019:
- 5,330 facilities in Region 5 reported to TRI, similar to reporting for 2018. These facilities were most commonly in the fabricated metals (i.e., manufacture of metal products) or chemical manufacturing sectors.
- While the figure shows the sectors with the most TRI facilities in the region, the sectors that reported the largest TRI releases in Region 5 were the primary metals (including iron and steel manufacturing, and foundries), electric utilities, chemical manufacturing, and hazardous waste management sectors. Note that relatively few facilities in the electric utilities and hazardous waste management sectors reported to TRI in this region and those sectors are included in “All Other Sectors” in the pie chart above.
- Nationwide, the metal mining, chemical manufacturing, primary metals, and electric utilities sectors reported the largest releases.
For information on the Region 5 facilities with the largest releases, see the Region 5 TRI Factsheet.
TRI Waste Management Trend
The following graph shows the annual quantities of TRI chemicals in production-related waste managed![]() production-related wasteThe sum of all non-accidental chemical waste generated at a facility. It is the sum of on-site environmental releases (minus quantities from non-routine, one-time events), on-site waste management (recycling, treatment, and combustion for energy recovery), and off-site transfers for disposal, treatment, recycling or energy recovery. by facilities located in Region 5. For more details on quantities released, toggle to the Releases graph.
production-related wasteThe sum of all non-accidental chemical waste generated at a facility. It is the sum of on-site environmental releases (minus quantities from non-routine, one-time events), on-site waste management (recycling, treatment, and combustion for energy recovery), and off-site transfers for disposal, treatment, recycling or energy recovery. by facilities located in Region 5. For more details on quantities released, toggle to the Releases graph.
Note: For comparability, trend graphs include only those chemicals that were reportable to TRI for all years presented.
In 2019:
- Facilities in Region 5 managed 5.87 billion pounds of production-related waste, 65% of which was managed through recycling, compared to 53% nationally.
- Since 2018, quantities of production-related waste managed in the region decreased by 8%.
From 2007 to 2019:
- Total production-related waste managed increased by 1.1 billion pounds (23%), driven by one plastics manufacturing facility that reported recycling more than a billion pounds of dichloromethane (methylene chloride) annually from 2013 to 2019 [Click to view facility details in the TRI P2 Search Tool]. Excluding this facility, production-related waste managed in the region decreased by 387 million pounds (-8%).
- Nationally, quantities of production-related waste managed increased by 23% since 2007, driven by increased recycling.
The following graph shows the annual quantities of TRI chemicals released by facilities located in Region 5.
Note: For comparability, trend graphs include only those chemicals that were reportable to TRI for all years presented.
In 2019:
Regional Highlight
Releases in Region 5 have decreased by almost 400 million pounds since 2007. Releases from the electric utilities, primary metals and hazardous waste sectors decreased the most, together decreasing by 374 million pounds.
- Facilities in Region 5 reported releasing 464 million pounds of TRI chemicals.
- The chemicals released in the largest quantities by medium were:
- To air: sulfuric acid, ammonia, and n-hexane;
- To water: nitrate compounds;
- To land: barium compounds, manganese compounds, and zinc compounds; and
- Transferred off site for disposal: zinc compounds and manganese compounds.
- Since 2018, releases decreased by 49.2 million pounds (-10%). Decreases occurred across many sectors, with the largest decreases in the hazardous waste management and electric utilities sectors. Releases decreased to all media except water, which increased. Nationally, releases decreased by 9%.
- Contributions by state to TRI releases in Region 5 were: Indiana (27%), Ohio (23%), Illinois (22%), Michigan (16%), Wisconsin (7%), and Minnesota (5%).
- To consider the potential health risk from chronic exposure to these releases, EPA provides a risk-screening score from the RSEI model. Contributions by state to the RSEI Score for Region 5 were: Ohio (33%), Illinois (30%), Indiana (16%), Michigan (12%), Wisconsin (5%), and Minnesota (4%).
- The RSEI model accounts for factors such as chemical properties and population density in addition to the pounds of TRI chemicals released. Additionally, RSEI does not model land disposal quantities. These factors can lead to significant differences between a state’s contribution to regional releases and its contribution to the regional RSEI Score.
From 2007 to 2019:
- Releases in Region 5 decreased by 399 million pounds (-46%), driven by reduced releases from electric utilities and the primary metals sector. Nationally, releases decreased by 19%.
- Releases to air, water, land, and transferred off site for disposal all decreased.
Source Reduction
In 2019, 7% of facilities in Region 5 (373 facilities) reported implementing new source reduction activities. Source reduction reporting rates in the region were among the highest in the computers/electronic products manufacturing sector, in which 23% of facilities reported source reduction activities. For example, a circuit board manufacturer reduced its copper usage by installing a new copper etcher that is more efficient than the previous equipment. [Click to view facility details in the TRI P2 Search Tool].
This page was published in January 2021 and uses the 2019 TRI National Analysis dataset made public in TRI Explorer in October 2020.