Regional Profile for EPA Region 9
This section examines TRI reporting in EPA Region 9. Region 9 includes Arizona, California, Hawaii, Nevada, the Pacific Islands (American Samoa, Guam, and the Northern Mariana Islands), and 148 Tribes.
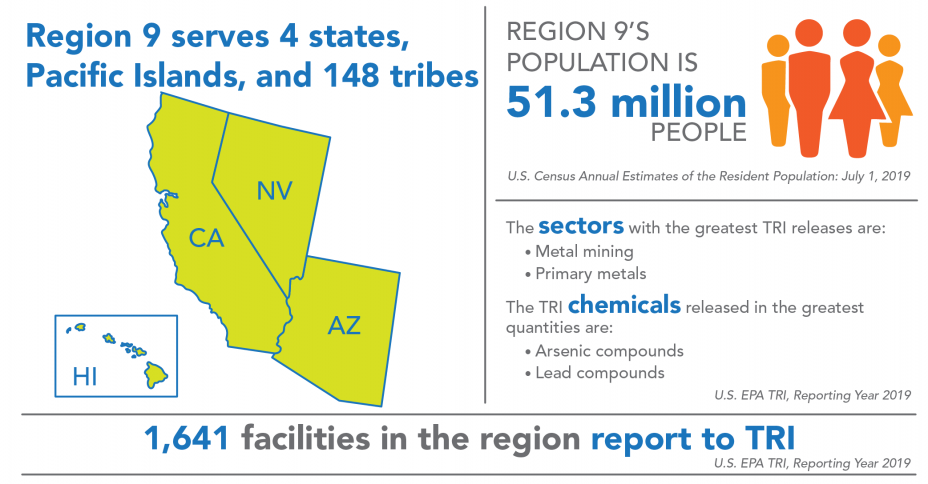
Region 9 covers 15% of the U.S. population and includes 8% of all facilities that report to TRI. For state- and tribe-specific TRI data, see the Where You Live section and the Tribal Communities section. Thirteen facilities located on the land of six different tribes in Region 9 reported to TRI for 2019.
Industry Sectors
This chart shows the industry sectors with the most TRI-reporting facilities in Region 9.
In 2019:
- 1,641 facilities in Region 9 reported to TRI, similar to reporting for 2018. These facilities were most commonly in the nonmetallic mineral products (including concrete and cement manufacturing) or chemical manufacturing sectors.
- While the figure shows the sectors with the most TRI facilities in the region, the most TRI releases in Region 9 were from the metal mining sector, which accounted for 78% of the region’s releases for 2019. After metal mining, the primary metals (including smelting), hazardous waste management, and petroleum products manufacturing sectors reported the largest releases. Note that relatively few facilities in the metal mining, primary metals, and hazardous waste management sectors reported to TRI in this region and those sectors are included in “All Other Sectors” in the pie chart above.
- Nationwide, the metal mining, chemical manufacturing, electric utilities, and primary metals sectors reported the largest releases.
- Metal mining facilities typically handle large volumes of material. In this sector, even a small change in the chemical composition of the mineral deposit being mined can lead to large changes in the amount of TRI-listed chemicals reported. Therefore, releases in Region 9, where 42 metal mines reported to TRI for 2019, may not follow national trends. For more information on the metal mining sector, see the metal mining sector profile.
For information on the Region 9 facilities with the largest releases, see the TRI Region 9 Factsheet.
TRI Waste Management Trend
The following graph shows the annual quantities of TRI chemicals in production-related waste managed![]() production-related wasteThe sum of all non-accidental chemical waste generated at a facility. It is the sum of on-site environmental releases (minus quantities from non-routine, one-time events), on-site waste management (recycling, treatment, and combustion for energy recovery), and off-site transfers for disposal, treatment, recycling or energy recovery. by facilities located in Region 9. For more details on quantities released, toggle to the Releases graph.
production-related wasteThe sum of all non-accidental chemical waste generated at a facility. It is the sum of on-site environmental releases (minus quantities from non-routine, one-time events), on-site waste management (recycling, treatment, and combustion for energy recovery), and off-site transfers for disposal, treatment, recycling or energy recovery. by facilities located in Region 9. For more details on quantities released, toggle to the Releases graph.
Note: For comparability, trend graphs include only those chemicals that were reportable to TRI for all years presented.
In 2019:
- Facilities in Region 9 managed 908 million pounds of production-related waste, 51% of which was disposed of or otherwise released, compared to 11% nationally. Metal mines drive the quantity of production-related waste released in Region 9. For 2019, metal mines in the region disposed of 90% of their waste on site to land.
- Since 2018, quantities of production-related waste managed in Region 9 increased by 3%, driven by increased production-related waste managed in the electrical equipment and metal mining sectors.
From 2007 to 2019:
- Total production-related waste managed decreased by 89.8 million pounds (-9%), driven by decreased recycling in the primary metals sector. In contrast, nationally, quantities of production-related waste managed increased by 23%, driven by increased recycling.
The following graph shows the annual quantities of TRI chemicals released by facilities located in Region 9.
Note: For comparability, trend graphs include only those chemicals that were reportable to TRI for all years presented.
In 2019:
Regional Highlight
42 metal mines in Region 9 reported to TRI for 2019, more than in any other region, accounting for 78% of the region’s releases. Most of the mining releases were reported by gold mines in Nevada.
- Facilities in Region 9 released 465 million pounds of TRI chemicals.
- The chemicals released in the largest quantities by medium were:
- To air: ammonia and sulfuric acid;
- To water: nitrate compounds;
- To land: arsenic compounds and lead compounds; and
- Transferred off site for disposal: nitrate compounds and manganese compounds
- Since 2018, releases stayed about the same, while nationally, releases decreased by 9%.
- Contributions by state to TRI releases in Region 9 were: Nevada (72%), Arizona (18%), California (8%), Hawaii (<1%), and the Pacific Islands (<1%).
- To consider the potential health risk from chronic exposure to these releases, EPA provides a risk-screening score from the RSEI model. Contributions by state to the RSEI Score for Region 9 were: California (43%), Nevada (40%), Arizona (15%), Hawaii (<1%), and the Pacific Islands (<1%).
- The RSEI model accounts for factors such as chemical properties and population density in addition to the pounds of TRI chemicals released. Additionally, RSEI does not model land disposal quantities. These factors can lead to significant differences between a state’s contribution to regional releases and its contribution to the regional RSEI Score.
From 2007 to 2019:
- Releases in Region 9 increased by 114 million pounds (32%), driven by increased releases from the metal mining sector, in which releases often vary substantially from year to year. In comparison, nationally, total releases of TRI chemicals decreased by 19%.
- Excluding the metal mining sector, releases in Region 9 increased by 5 million pounds (5%).
- Quantities of chemicals released to air and water decreased, while land disposal and off-site transfers for disposal increased.
Source Reduction
In 2019, 6% of facilities in Region 9 (105 facilities) reported implementing new source reduction activities. Source reduction reporting rates in the region were among the highest in the electrical equipment sector, in which 22% of facilities reported at least one source reduction activity. For example, an electrical equipment manufacturer replaced a wave solder machine with a new selective solder machine that helped reduce the amount of lead used in the process. [Click to view facility details in the TRI P2 Search Tool].
This page was published in January 2021 and uses the 2019 TRI National Analysis dataset made public in TRI Explorer in October 2020.